1 Introduction
1.1 Learning objectives
Lorem ipsum dolor sit amet, consectetur adipiscing elit. Pellentesque laoreet tortor nec eros mollis aliquam id eu libero. Aenean ac elit ex. Sed sit amet sagittis erat. Donec ornare arcu sed eros pharetra finibus. Fusce pharetra lacus iaculis, volutpat felis vel, tristique diam. Sed a leo vestibulum, rutrum libero quis, dapibus ex. Ut venenatis felis et facilisis blandit. Sed eu porttitor tellus. Maecenas feugiat congue malesuada. Phasellus in sem lectus. Proin commodo lobortis nibh, sed blandit metus venenatis in. Etiam sit amet lacus eget metus egestas congue vitae eu dolor. Integer ultrices malesuada nulla sed sollicitudin. Mauris commodo nulla mauris, sed luctus nulla posuere sit amet. Mauris sodales nisl lacus, et pretium erat sollicitudin ac.
1.2 Tools
1.2.1 Excalidraw
Throughout this course, we will design and visualize many Kubernetes architectures before implementing them, and Excalidraw is the tool we chose for the job. It is an open-source virtual whiteboard that produces clean, hand-drawn-style sketches and runs entirely in the browser with no installation required.
However, if you prefer to work inside your editor, Excalidraw is also available as an extension for the most popular IDEs:
- VS Code: Excalidraw Editor on the Visual Studio Marketplace.
- JetBrains IDEs (IntelliJ, WebStorm, GoLand, CLion, etc.): Excalidraw Integration on the JetBrains Marketplace.
We use Excalidraw to design and visualize Kubernetes architectures before implementing them. Each chapter includes the source .excalidraw file alongside the exported PNG.
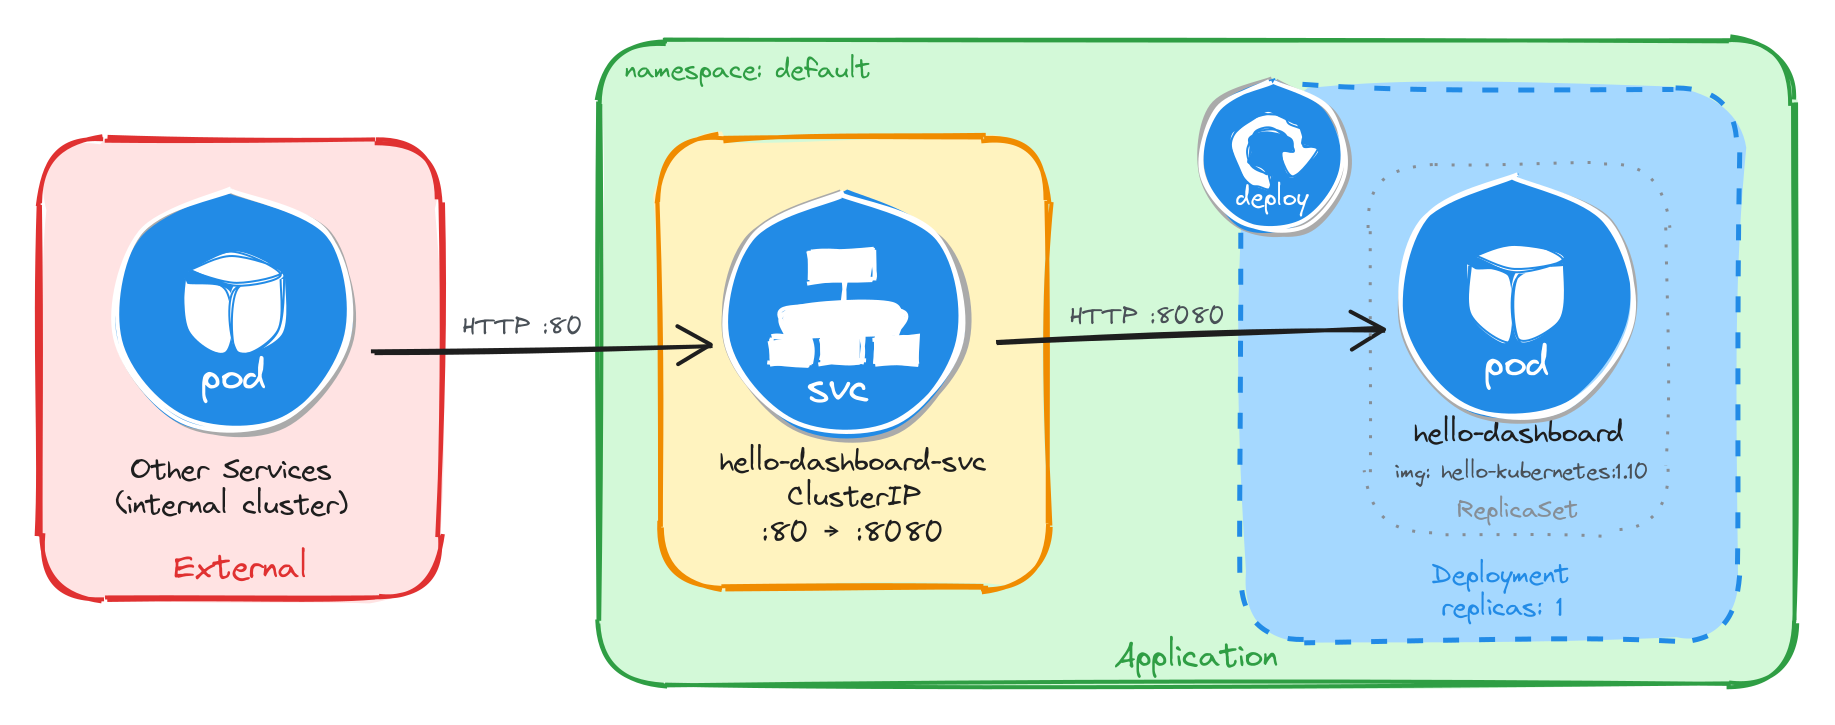
As an example, here is the architecture diagram for a Deployment exposed through a ClusterIP Service, reachable only from inside the cluster:
1.2.1.1 How to install Kubernetes icons in Excalidraw
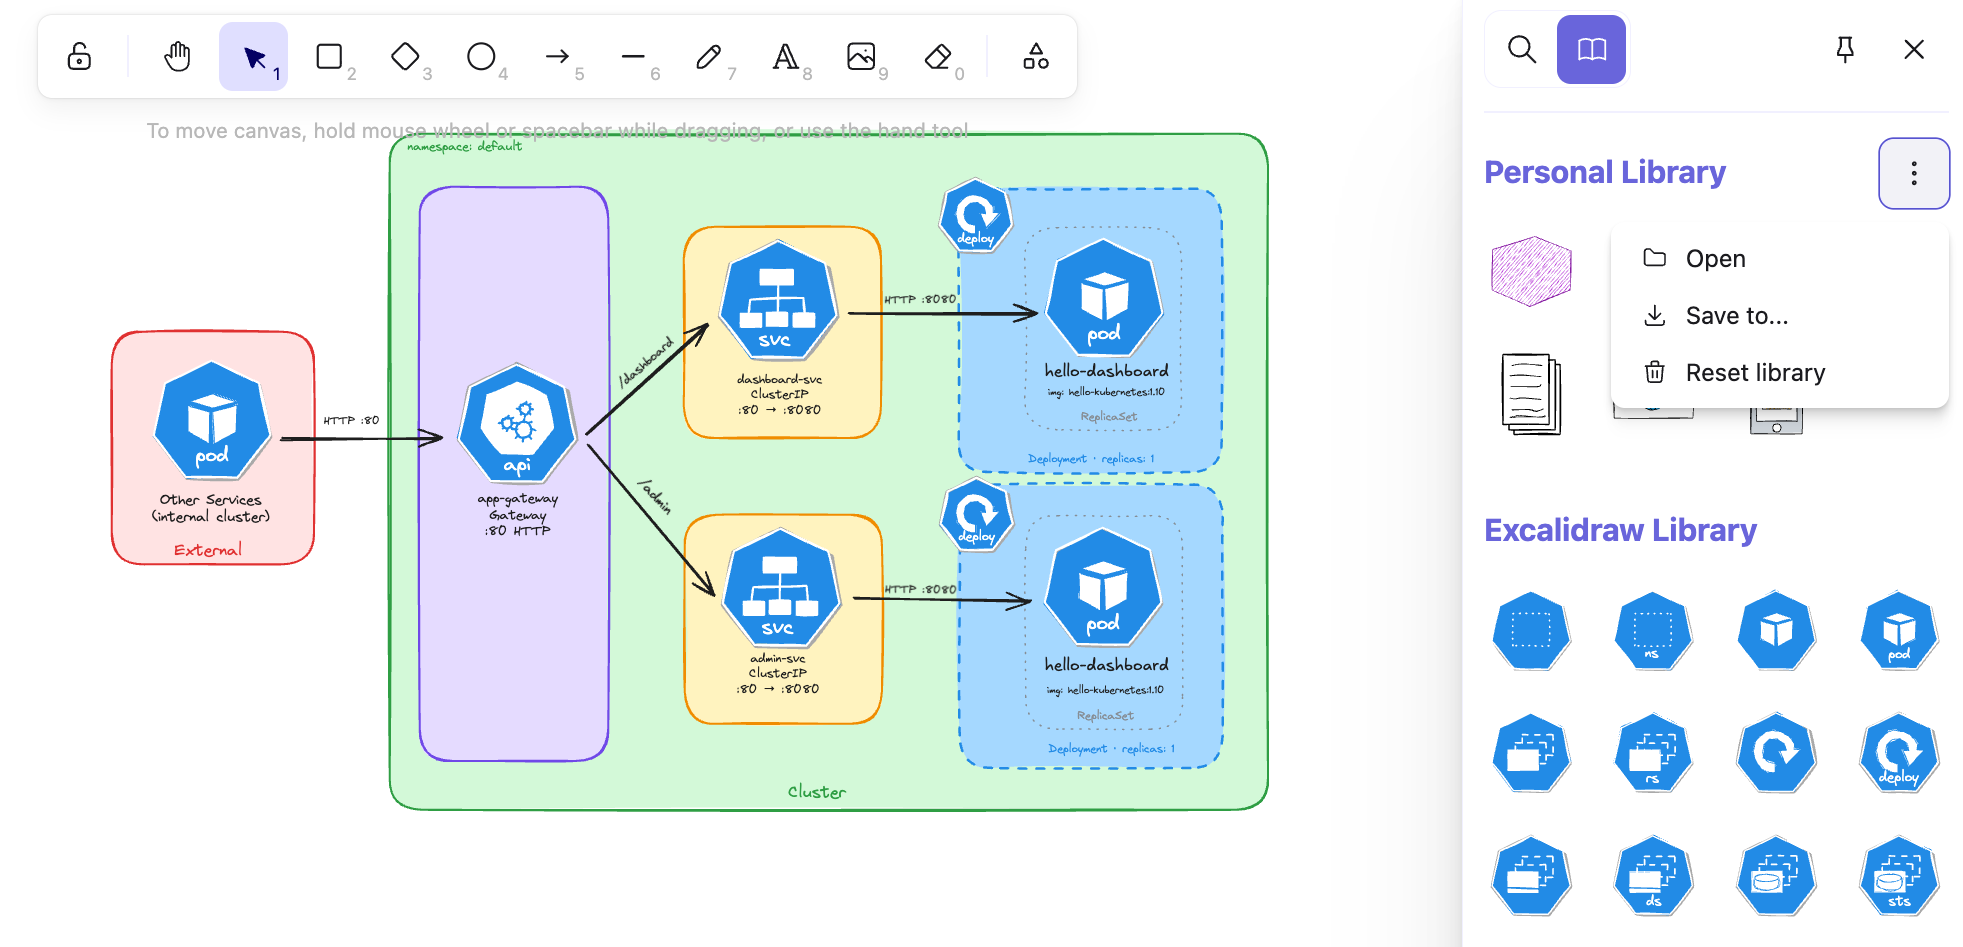
In your local editor, open any .excalidraw file, then click Open in the right panel and select the .excalidrawlib file you want to import. The library will be added to your asset list, and you can start using the icons in your diagrams right away.
We used the Kubernetes Icons library for our diagrams, but feel free to explore other libraries or create your own!
The image below shows the import process in VS Code, but the steps are identical in the browser.
1.2.2 Killercoda
The best way to learn the tools used in this course is to use them hands-on in a safe, interactive environment with no local setup required. This is why we chose Killercoda as our playground:
Killercoda is a platform for learning and practicing skills in a safe and interactive environment. It provides hands-on experience with real-world tools and techniques, allowing users to develop their skills and knowledge in a practical way.
Killercoda offers a wide range of scenarios for various topics and skill levels. For this course specifically, we created a custom playground that includes all the tools and resources needed to complete the tasks. You can access it at https://killercoda.com/isislab/scenario/exam-playground.
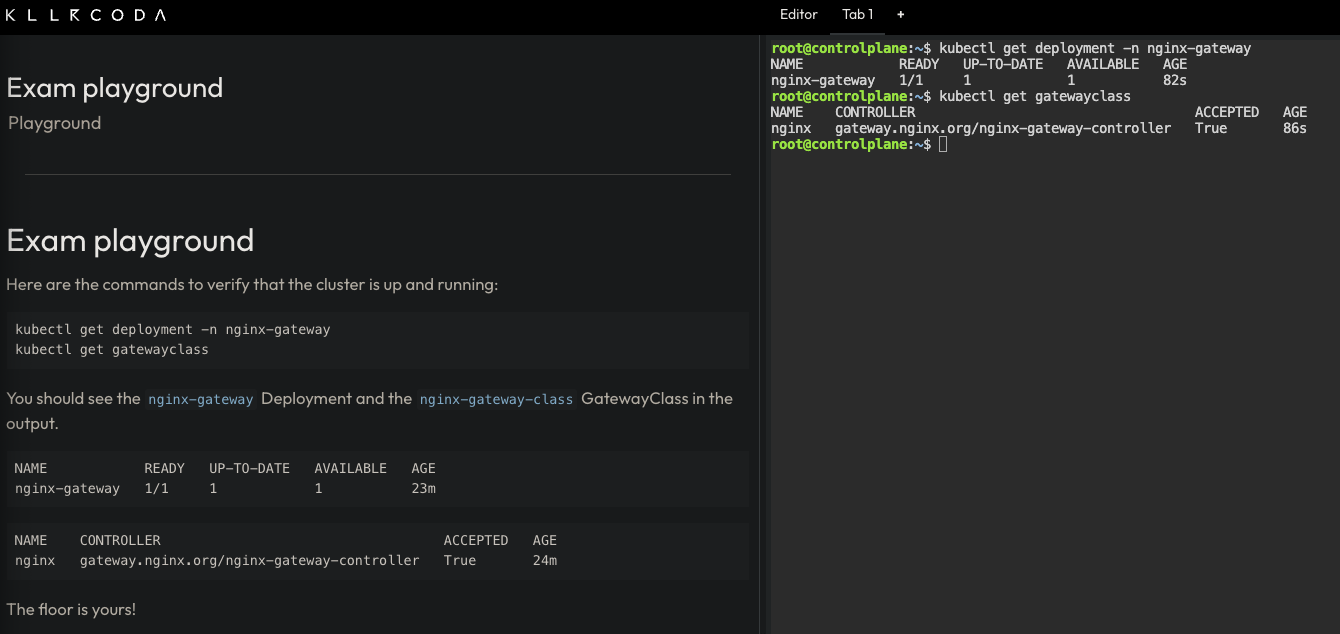
1.2.2.1 How to use the Killercoda playground
Navigate to https://killercoda.com/isislab/scenario/exam-playground and start the scenario. This will provision a Kubernetes cluster and deploy all the resources needed for the tasks.
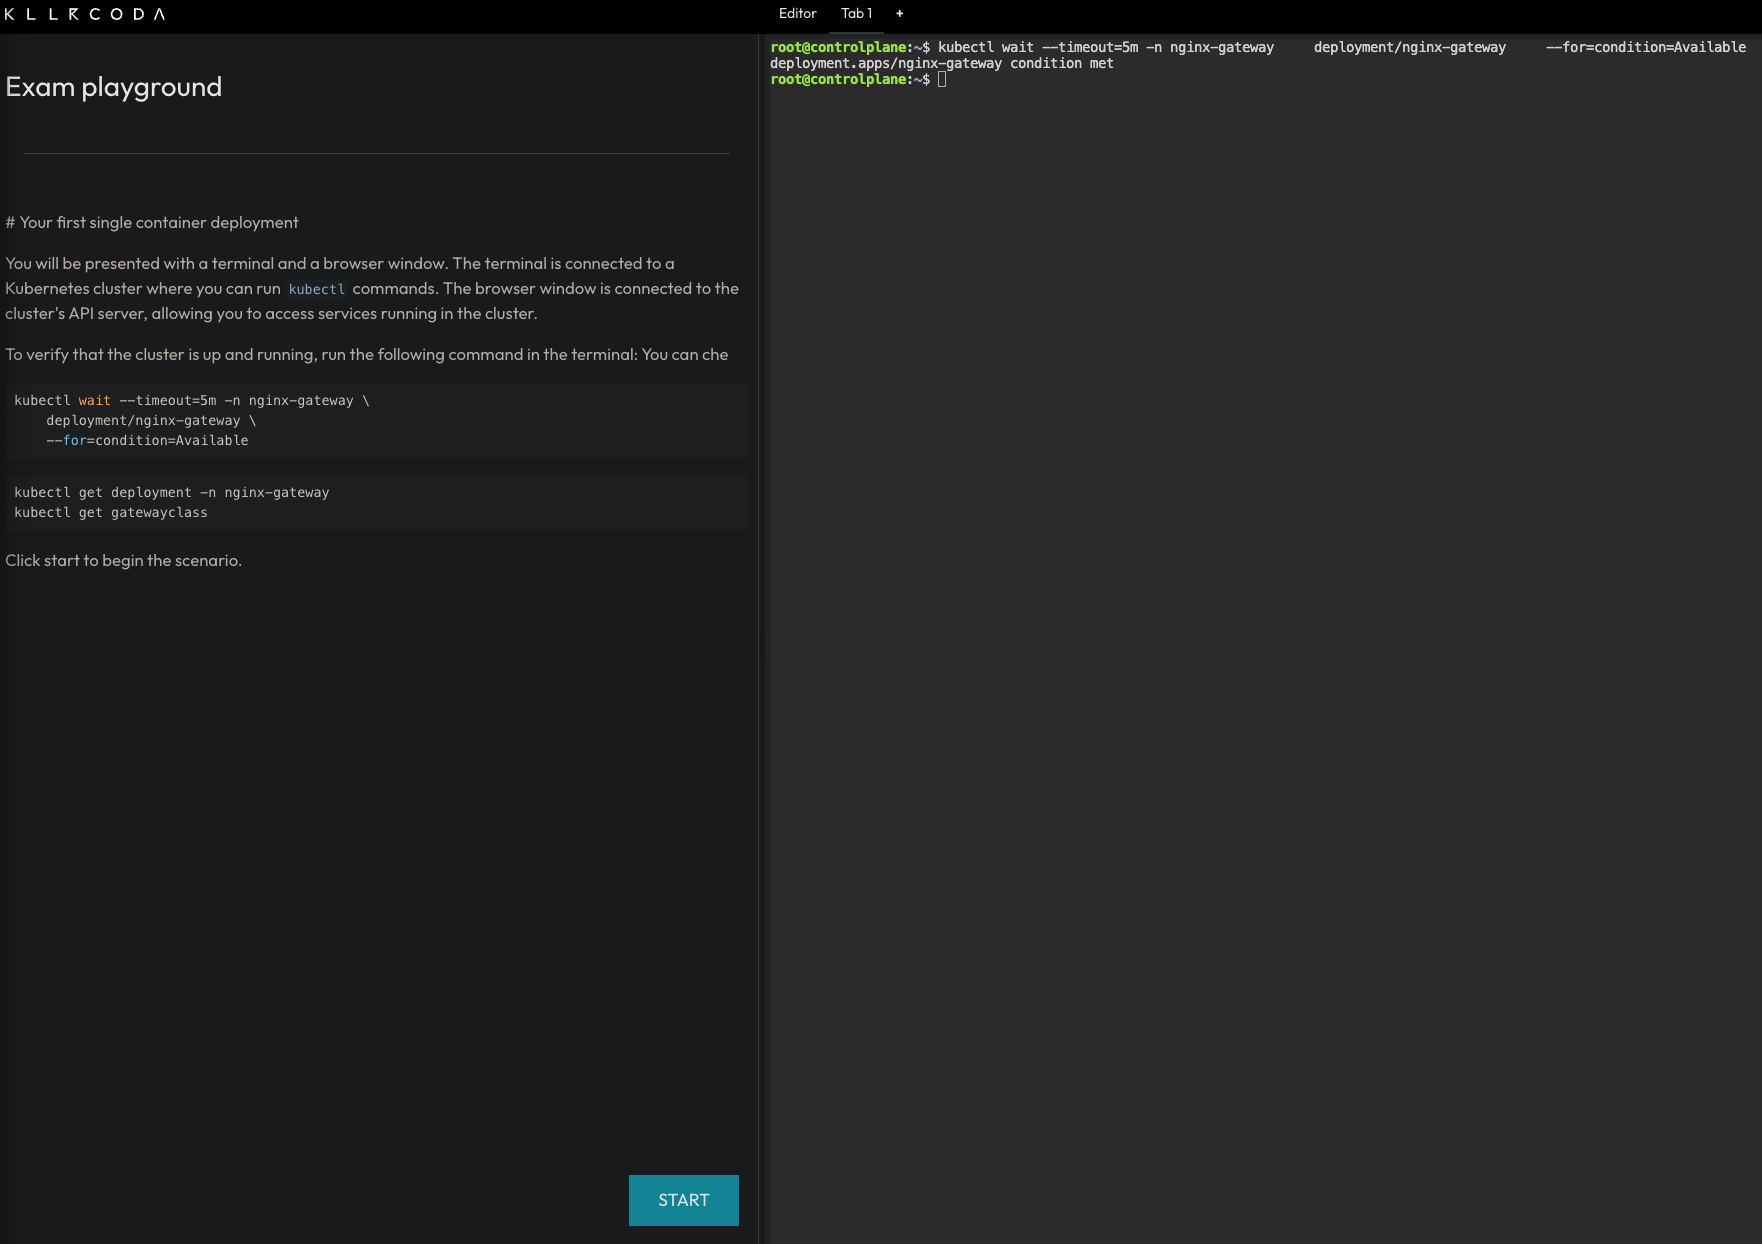
Once the setup completes, you will have a personal playground instance with a running Kubernetes cluster and a terminal with all the necessary tools pre-installed. Use this terminal to run kubectl commands and interact with the cluster as you work through the tasks.
1.2.3 Busybox
Busybox is a minimal Linux image that bundles many common Unix utilities into a single small executable. It is widely used in container environments where image size matters and a full OS is not needed.
In this course, we use Busybox as a lightweight Pod to run quick diagnostic commands inside the cluster without deploying a full application container. For example, checking network connectivity, resolving DNS, or inspecting environment variables.
To get a feel for it, you can run a Busybox container locally with Docker and explore the tools it provides:
docker run -it --rm busybox sh
This starts an interactive shell inside a Busybox container. From there, you can run commands like wget, ping, or env. These are the same utilities you will use later inside Kubernetes Pods.
1.3 How to contribute via GitHub
We welcome all kinds of contributions: bug fixes, content improvements, and suggestions for new exercises or topics. The project is fully hosted on GitHub. See CONTRIBUTING.md for setup instructions and the contribution workflow.
1.3.1 Adding a new topic
Create a Markdown file in the src directory and add an entry for it in SUMMARY.md.
Chapter, section, and subsection numbering is handled automatically by the preprocessor in book.toml. For example, # maps to 1., ## to 1.1., and ### to 1.1.1..
1.3.2 Adding a task to an existing topic
Add a new section at the appropriate heading level and follow the format of the existing tasks in that file.
1.3.3 Adding diagrams
Draw your diagram in Excalidraw and place the source .excalidraw file in src/diagrams. The build process will export it as a PNG to src/diagrams_images, which you can then reference in your Markdown file.
2 Structure of tasks
Every task in this book follows the same three-part structure: a scenario that sets the context, an architectural design that justifies the solution, and an implementation that walks through the commands.
2.1 Scenario
Each task opens with a short scenario describing what the team needs. The scenario establishes the functional requirement (what the application does), the container image to use, the resilience expectations (whether brief downtime is acceptable or not), and the accessibility constraints (internal-only, externally reachable, etc.). These constraints are what drive the architectural decisions that follow.
2.2 Architectural design
The architectural design section translates the scenario constraints into concrete design decisions. Each decision is linked to a specific constraint and to the Kubernetes resource that satisfies it. For example, if the task allows brief downtime, this section explains why a single-replica Deployment is sufficient. If the application must be reachable only from inside the cluster, it explains why a ClusterIP Service is the right choice and why no Ingress or Gateway is needed.
This section also includes an architecture diagram that shows the resulting resource topology: how external and internal clients interact (or do not interact) with the application, and how traffic flows from the Service into the Pod managed by the Deployment.
2.3 Implementation
The implementation section provides the step-by-step commands to deploy the solution. It is organized into three parts:
-
Resource creation: The main
kubectlcommands to create the Kubernetes resources required to implement the architectural design. Each command is explained: why a particular flag or value was chosen, and how it connects back to the architectural design. Where useful, a--dry-run=client -o yamlvariant of the command is included so the reader can inspect the generated YAML before applying it. -
Verify resource creation:: A list of commands to confirm that the resources were created correctly. This typically includes checking things like whether a Pod is running or a Service has the expected type, ports, and no unintended external IP.
-
Test the application: A practical test that validates end-to-end connectivity. This usually involves creating a temporary Pod (such as busybox) inside the cluster and using
wgetto send a request to the Service. The expected response is shown so you can confirm that the application is working as intended.
3 Single-container deployment
Design and deploy a simple single-container application with a service for internal access.
This category includes the following learning objectives:
- Understanding of Pods.
- Understanding of Deployments.
- Understanding of ClusterIP services.
3.1 Task 1: Design and deploy an internal dashboard
Your team needs an internal monitoring dashboard that runs inside the cluster and shows, at any time, the node and namespace they are working in.
The dashboard must be packaged as a single container image (hello-kubernetes dashboard). It does not need to be highly resilient, since brief periods of unavailability are acceptable.
However, other services inside the cluster need a stable address to reach it, so Pod IPs alone are not enough. Make sure the dashboard is strictly for internal use and not accessible from outside the cluster.
3.1.1 Architectural design
The task requires a single container image, brief downtime is acceptable, and the dashboard must be reachable only from inside the cluster. These constraints drive three design decisions:
-
Because the application is a single container, a Deployment with one replica is enough. The Deployment creates a ReplicaSet that manages the Pod. If the Pod crashes, the ReplicaSet recreates it automatically at the cost of a short period of unavailability, which the task explicitly allows.
-
Other services need a stable address to reach the dashboard. Pod IPs change every time a Pod is recreated, so we place a ClusterIP Service (
hello-dashboard-svc) in front of the Pod. The Service provides a fixed cluster-internal DNS name and load-balances traffic to the Pod. It accepts requests on port80and forwards them to the container’s port8080. -
The dashboard must not be accessible from outside the cluster. A ClusterIP Service has no external port and no route from outside the cluster network, so it satisfies this requirement by design. No Gateway, Ingress, or NodePort is needed.
The diagram shows the resulting architecture: external clients have no path into the application, while internal services reach the dashboard through the ClusterIP Service, which forwards traffic into the Pod managed by the Deployment.
3.1.2 Implementation
We start by creating a Deployment with a single replica (the default). The task allows short periods of unavailability, so one instance is enough. We use the paulbouwer/hello-kubernetes:1.10 image and declare that the container listens on port 8080. The kubectl create deployment command automatically adds the label app=hello-dashboard to the Pods, which will be useful later when we create the Service.
kubectl create deployment hello-dashboard \
    --image=paulbouwer/hello-kubernetes:1.10 \
    --port=8080
To inspect the YAML that would be applied without actually creating the resource, use the --dry-run=client -o yaml flags:
kubectl create deployment hello-dashboard \
    --image=paulbouwer/hello-kubernetes:1.10 \
    --port=8080 \
    --dry-run=client -o yaml
The output should look similar to this:
apiVersion: apps/v1
kind: Deployment
metadata:
  creationTimestamp: null
  labels:
    app: hello-dashboard
  name: hello-dashboard
spec:
  replicas: 1
  selector:
    matchLabels:
      app: hello-dashboard
  strategy: {}
  template:
    metadata:
      creationTimestamp: null
      labels:
        app: hello-dashboard
    spec:
      containers:
      - image: paulbouwer/hello-kubernetes:1.10
        name: hello-kubernetes
        ports:
        - containerPort: 8080
        resources: {}
status: {}
Next, we expose the Deployment as a ClusterIP Service. ClusterIP is the right choice here because it gives other services inside the cluster a stable address for reaching the dashboard while keeping it inaccessible from outside.
We use kubectl expose instead of creating the Service manually with kubectl create service clusterip because it automatically sets the selector to match the Deployment Pods, which is exactly the wiring we need. The Service listens on port 80 and forwards traffic to the container port 8080.
kubectl expose deployment hello-dashboard \
    --name=hello-dashboard-svc \
    --type=ClusterIP \
    --port=80 \
    --target-port=8080
3.1.2.1 Verify resource creation
To verify that the Pod is running, execute the following command, which filters Pods by the app=hello-dashboard label automatically set by kubectl create deployment:
kubectl get pods -l app=hello-dashboard
The output should look similar to this:
NAME                               READY   STATUS    RESTARTS   AGE
hello-dashboard-6bfbf8b67c-jv8tv   1/1     Running   0          16m
To verify that the Service is configured correctly, run:
kubectl get svc hello-dashboard-svc
The output should look similar to this:
NAME                  TYPE        CLUSTER-IP     EXTERNAL-IP   PORT(S)   AGE
hello-dashboard-svc   ClusterIP   10.111.28.77   <none>        80/TCP    15
From this output, we can confirm that internal access to the dashboard is available at http://hello-dashboard-svc:80 and that external access is not possible, since no external IP is assigned.
3.1.2.2 Test the dashboard
To test the dashboard, create a temporary Pod using busybox:
kubectl run -it --rm --restart=Never busybox --image=busybox sh
Inside the busybox Pod, use wget to access the dashboard through the Service ClusterIP. The dashboard should respond with an HTML page containing cluster information.
wget -qO- http://hello-dashboard-svc
The dashboard HTML should look similar to the example below:
<!DOCTYPE html>
<html>
    <head>
        <title>Hello Kubernetes!</title>
        <!-- CSS styles omitted for brevity -->
    </head>
    <body>
        <div class="main">
            <!-- Content omitted for brevity -->
            <div class="content">
                <div id="message">Hello world!</div>
                <div id="info">
                <table>
                    <tr><th>namespace:</th><td>-</td></tr>
                    <tr><th>pod:</th><td>hello-dashboard-6bfbf8b67c-jv8tv</td></tr>
                    <tr><th>node:</th><td>- (Linux 6.8.0-94-generic)</td></tr>
                </table>
                </div>
            </div>
        </div>
    </body>
</html>
3.2 Task 2: Design and deploy an internal request inspector
Your team needs an internal debugging tool that runs inside the cluster and displays HTTP request details such as headers, source IP, and hostname. This helps developers verify how traffic flows through the cluster.
The tool must be packaged as a single container image (traefik/whoami). It does not need to be highly resilient, since brief periods of unavailability are acceptable.
However, other services inside the cluster need a stable address to reach it, so Pod IPs alone are not enough. Make sure the tool is strictly for internal use and not accessible from outside the cluster.
3.2.1 Architectural design
The task requires a single container image, brief downtime is acceptable, and the request inspector must be reachable only from inside the cluster. These constraints drive three design decisions:
-
Because the application is a single container, a Deployment with one replica is enough. The Deployment creates a ReplicaSet that manages the Pod. If the Pod crashes, the ReplicaSet recreates it automatically at the cost of a short period of unavailability, which the task explicitly allows.
-
Other services need a stable address to reach the request inspector. Pod IPs change every time a Pod is recreated, so we place a ClusterIP Service (
whoami-inspector-svc) in front of the Pod. The Service provides a fixed cluster-internal DNS name and load-balances traffic to the Pod. It accepts requests on port8080and forwards them to the container’s port80. -
The request inspector must not be accessible from outside the cluster. A ClusterIP Service has no external port and no route from outside the cluster network, so it satisfies this requirement by design. No Gateway, Ingress, or NodePort is needed.

The diagram shows the resulting architecture: external clients have no path into the application, while internal services reach the request inspector through the ClusterIP Service, which forwards traffic into the Pod managed by the Deployment.
3.2.2 Implementation
We start by creating a Deployment with a single replica (the default). The task allows short periods of unavailability, so one instance is enough. We use the traefik/whoami:v1.10 image and declare that the container listens on port 80. The kubectl create deployment command automatically adds the label app=whoami-inspector to the Pods, which will be useful later when we create the Service.
kubectl create deployment whoami-inspector \
    --image=traefik/whoami:v1.10 \
    --port=80
To inspect the YAML that would be applied without actually creating the resource, use the --dry-run=client -o yaml flags:
kubectl create deployment whoami-inspector \
    --image=traefik/whoami:v1.10 \
    --port=80 \
    --dry-run=client -o yaml
The output should look similar to this:
apiVersion: apps/v1
kind: Deployment
metadata:
  creationTimestamp: null
  labels:
    app: whoami-inspector
  name: whoami-inspector
spec:
  replicas: 1
  selector:
    matchLabels:
      app: whoami-inspector
  strategy: {}
  template:
    metadata:
      creationTimestamp: null
      labels:
        app: whoami-inspector
    spec:
      containers:
      - image: traefik/whoami:v1.10
        name: whoami
        ports:
        - containerPort: 80
        resources: {}
status: {}
Next, we expose the Deployment as a ClusterIP Service. ClusterIP is the right choice here because it gives other services inside the cluster a stable address for reaching the request inspector while keeping it inaccessible from outside.
We use kubectl expose instead of creating the Service manually with kubectl create service clusterip because it automatically sets the selector to match the Deployment Pods, which is exactly the wiring we need. The Service listens on port 8080 and forwards traffic to the container port 80.
kubectl expose deployment whoami-inspector \
    --name=whoami-inspector-svc \
    --type=ClusterIP \
    --port=8080 \
    --target-port=80
3.2.2.1 Verify resource creation
To verify that the Pod is running, execute the following command, which filters Pods by the app=whoami-inspector label automatically set by kubectl create deployment:
kubectl get pods -l app=whoami-inspector
The output should look similar to this:
NAME                                READY   STATUS    RESTARTS   AGE
whoami-inspector-5f4b8d7c9a-k2m7p   1/1     Running   0          12m
To verify that the Service is configured correctly, run:
kubectl get svc whoami-inspector-svc
The output should look similar to this:
NAME                   TYPE        CLUSTER-IP      EXTERNAL-IP   PORT(S)    AGE
whoami-inspector-svc   ClusterIP   10.96.145.203   <none>        8080/TCP   10m
From this output, we can confirm that internal access to the request inspector is available at http://whoami-inspector-svc:8080 and that external access is not possible, since no external IP is assigned.
3.2.2.2 Test the request inspector
To test the request inspector, create a temporary Pod using busybox:
kubectl run -it --rm --restart=Never busybox --image=busybox sh
Inside the busybox Pod, use wget to access the request inspector through the Service ClusterIP. The tool should respond with plain text showing HTTP request details.
wget -qO- http://whoami-inspector-svc:8080
The response should look similar to the example below:
Hostname: whoami-inspector-5f4b8d7c9a-k2m7p
IP: 127.0.0.1
IP: 10.244.0.12
RemoteAddr: 10.244.0.1:48372
GET / HTTP/1.1
Host: whoami-inspector-svc:8080
User-Agent: Wget
3.3 Task 3: Design and deploy an internal health endpoint
Your team needs an internal health endpoint that runs inside the cluster and returns pod metadata in JSON format. This helps the platform team verify cluster connectivity and inspect runtime information about running workloads.
The endpoint must be packaged as a single container image (podinfo). It does not need to be highly resilient, since brief periods of unavailability are acceptable.
However, other services inside the cluster need a stable address to reach it, so Pod IPs alone are not enough. Make sure the endpoint is strictly for internal use and not accessible from outside the cluster.
3.3.1 Architectural design
The task requires a single container image, brief downtime is acceptable, and the health endpoint must be reachable only from inside the cluster. These constraints drive three design decisions:
-
Because the application is a single container, a Deployment with one replica is enough. The Deployment creates a ReplicaSet that manages the Pod. If the Pod crashes, the ReplicaSet recreates it automatically at the cost of a short period of unavailability, which the task explicitly allows.
-
Other services need a stable address to reach the health endpoint. Pod IPs change every time a Pod is recreated, so we place a ClusterIP Service (
podinfo-health-svc) in front of the Pod. The Service provides a fixed cluster-internal DNS name and load-balances traffic to the Pod. It accepts requests on port9090and forwards them to the container’s port9898. -
The health endpoint must not be accessible from outside the cluster. A ClusterIP Service has no external port and no route from outside the cluster network, so it satisfies this requirement by design. No Gateway, Ingress, or NodePort is needed.

The diagram shows the resulting architecture: external clients have no path into the application, while internal services reach the health endpoint through the ClusterIP Service, which forwards traffic into the Pod managed by the Deployment.
3.3.2 Implementation
We start by creating a Deployment with a single replica (the default). The task allows short periods of unavailability, so one instance is enough. We use the stefanprodan/podinfo:6.4.0 image and declare that the container listens on port 9898. The kubectl create deployment command automatically adds the label app=podinfo-health to the Pods, which will be useful later when we create the Service.
kubectl create deployment podinfo-health \
    --image=stefanprodan/podinfo:6.4.0 \
    --port=9898
To inspect the YAML that would be applied without actually creating the resource, use the --dry-run=client -o yaml flags:
kubectl create deployment podinfo-health \
    --image=stefanprodan/podinfo:6.4.0 \
    --port=9898 \
    --dry-run=client -o yaml
The output should look similar to this:
apiVersion: apps/v1
kind: Deployment
metadata:
  creationTimestamp: null
  labels:
    app: podinfo-health
  name: podinfo-health
spec:
  replicas: 1
  selector:
    matchLabels:
      app: podinfo-health
  strategy: {}
  template:
    metadata:
      creationTimestamp: null
      labels:
        app: podinfo-health
    spec:
      containers:
      - image: stefanprodan/podinfo:6.4.0
        name: podinfo
        ports:
        - containerPort: 9898
        resources: {}
status: {}
Next, we expose the Deployment as a ClusterIP Service. ClusterIP is the right choice here because it gives other services inside the cluster a stable address for reaching the health endpoint while keeping it inaccessible from outside.
We use kubectl expose instead of creating the Service manually with kubectl create service clusterip because it automatically sets the selector to match the Deployment Pods, which is exactly the wiring we need. The Service listens on port 9090 and forwards traffic to the container port 9898.
kubectl expose deployment podinfo-health \
    --name=podinfo-health-svc \
    --type=ClusterIP \
    --port=9090 \
    --target-port=9898
3.3.2.1 Verify resource creation
To verify that the Pod is running, execute the following command, which filters Pods by the app=podinfo-health label automatically set by kubectl create deployment:
kubectl get pods -l app=podinfo-health
The output should look similar to this:
NAME                              READY   STATUS    RESTARTS   AGE
podinfo-health-7d6c8b4f59-r3n8x   1/1     Running   0          8m
To verify that the Service is configured correctly, run:
kubectl get svc podinfo-health-svc
The output should look similar to this:
NAME                 TYPE        CLUSTER-IP      EXTERNAL-IP   PORT(S)    AGE
podinfo-health-svc   ClusterIP   10.104.72.186   <none>        9090/TCP   6m
From this output, we can confirm that internal access to the health endpoint is available at http://podinfo-health-svc:9090 and that external access is not possible, since no external IP is assigned.
3.3.2.2 Test the health endpoint
To test the health endpoint, create a temporary Pod using busybox:
kubectl run -it --rm --restart=Never busybox --image=busybox sh
Inside the busybox Pod, use wget to access the health endpoint through the Service ClusterIP. The endpoint should respond with a JSON payload containing pod metadata.
wget -qO- http://podinfo-health-svc:9090
The response should look similar to the example below:
{
  "hostname": "podinfo-health-7d6c8b4f59-r3n8x",
  "version": "6.4.0",
  "revision": "",
  "color": "#34577c",
  "logo": "https://raw.githubusercontent.com/stefanprodan/podinfo/gh-pages/cuddle_clap.gif",
  "message": "greetings from podinfo v6.4.0",
  "goos": "linux",
  "goarch": "amd64",
  "runtime": "go1.21.0",
  "num_goroutine": "8",
  "num_cpu": "2"
}
3.4 Task 4: Design and deploy an internal welcome page
Your team needs an internal welcome page that runs inside the cluster and displays server information such as the server address, server name, and request URI. This helps developers quickly confirm that routing and DNS resolution are working correctly.
The welcome page must be packaged as a single container image (nginxdemos/hello). It does not need to be highly resilient, since brief periods of unavailability are acceptable.
However, other services inside the cluster need a stable address to reach it, so Pod IPs alone are not enough. Make sure the welcome page is strictly for internal use and not accessible from outside the cluster.
3.4.1 Architectural design
The task requires a single container image, brief downtime is acceptable, and the welcome page must be reachable only from inside the cluster. These constraints drive three design decisions:
-
Because the application is a single container, a Deployment with one replica is enough. The Deployment creates a ReplicaSet that manages the Pod. If the Pod crashes, the ReplicaSet recreates it automatically at the cost of a short period of unavailability, which the task explicitly allows.
-
Other services need a stable address to reach the welcome page. Pod IPs change every time a Pod is recreated, so we place a ClusterIP Service (
nginx-welcome-svc) in front of the Pod. The Service provides a fixed cluster-internal DNS name and load-balances traffic to the Pod. It accepts requests on port3000and forwards them to the container’s port80. -
The welcome page must not be accessible from outside the cluster. A ClusterIP Service has no external port and no route from outside the cluster network, so it satisfies this requirement by design. No Gateway, Ingress, or NodePort is needed.

The diagram shows the resulting architecture: external clients have no path into the application, while internal services reach the welcome page through the ClusterIP Service, which forwards traffic into the Pod managed by the Deployment.
3.4.2 Implementation
We start by creating a Deployment with a single replica (the default). The task allows short periods of unavailability, so one instance is enough. We use the nginxdemos/hello:plain-text image and declare that the container listens on port 80. The kubectl create deployment command automatically adds the label app=nginx-welcome to the Pods, which will be useful later when we create the Service.
kubectl create deployment nginx-welcome \
    --image=nginxdemos/hello:plain-text \
    --port=80
To inspect the YAML that would be applied without actually creating the resource, use the --dry-run=client -o yaml flags:
kubectl create deployment nginx-welcome \
    --image=nginxdemos/hello:plain-text \
    --port=80 \
    --dry-run=client -o yaml
The output should look similar to this:
apiVersion: apps/v1
kind: Deployment
metadata:
  creationTimestamp: null
  labels:
    app: nginx-welcome
  name: nginx-welcome
spec:
  replicas: 1
  selector:
    matchLabels:
      app: nginx-welcome
  strategy: {}
  template:
    metadata:
      creationTimestamp: null
      labels:
        app: nginx-welcome
    spec:
      containers:
      - image: nginxdemos/hello:plain-text
        name: hello
        ports:
        - containerPort: 80
        resources: {}
status: {}
Next, we expose the Deployment as a ClusterIP Service. ClusterIP is the right choice here because it gives other services inside the cluster a stable address for reaching the welcome page while keeping it inaccessible from outside.
We use kubectl expose instead of creating the Service manually with kubectl create service clusterip because it automatically sets the selector to match the Deployment Pods, which is exactly the wiring we need. The Service listens on port 3000 and forwards traffic to the container port 80.
kubectl expose deployment nginx-welcome \
    --name=nginx-welcome-svc \
    --type=ClusterIP \
    --port=3000 \
    --target-port=80
3.4.2.1 Verify resource creation
To verify that the Pod is running, execute the following command, which filters Pods by the app=nginx-welcome label automatically set by kubectl create deployment:
kubectl get pods -l app=nginx-welcome
The output should look similar to this:
NAME                             READY   STATUS    RESTARTS   AGE
nginx-welcome-6c9d4f8b5a-t4w2q   1/1     Running   0          10m
To verify that the Service is configured correctly, run:
kubectl get svc nginx-welcome-svc
The output should look similar to this:
NAME                TYPE        CLUSTER-IP      EXTERNAL-IP   PORT(S)    AGE
nginx-welcome-svc   ClusterIP   10.98.231.114   <none>        3000/TCP   8m
From this output, we can confirm that internal access to the welcome page is available at http://nginx-welcome-svc:3000 and that external access is not possible, since no external IP is assigned.
3.4.2.2 Test the welcome page
To test the welcome page, create a temporary Pod using busybox:
kubectl run -it --rm --restart=Never busybox --image=busybox sh
Inside the busybox Pod, use wget to access the welcome page through the Service ClusterIP. The page should respond with plain text showing server information.
wget -qO- http://nginx-welcome-svc:3000
The response should look similar to the example below:
Server address: 10.244.0.15:80
Server name: nginx-welcome-6c9d4f8b5a-t4w2q
Date: 25/Mar/2026:10:32:18 +0000
URI: /
Request ID: a1b2c3d4e5f6a7b8c9d0e1f2a3b4c5d6
3.5 Task 5: Design and deploy an internal echo service
Your team needs an internal echo service that runs inside the cluster and mirrors back the body of any HTTP request it receives. This helps developers test and validate payloads sent by other microservices without needing an external tool.
The echo service must be packaged as a single container image (jmalloc/echo-server). It does not need to be highly resilient, since brief periods of unavailability are acceptable.
However, other services inside the cluster need a stable address to reach it, so Pod IPs alone are not enough. Make sure the echo service is strictly for internal use and not accessible from outside the cluster.
3.5.1 Architectural design
The task requires a single container image, brief downtime is acceptable, and the echo service must be reachable only from inside the cluster. These constraints drive three design decisions:
-
Because the application is a single container, a Deployment with one replica is enough. The Deployment creates a ReplicaSet that manages the Pod. If the Pod crashes, the ReplicaSet recreates it automatically at the cost of a short period of unavailability, which the task explicitly allows.
-
Other services need a stable address to reach the echo service. Pod IPs change every time a Pod is recreated, so we place a ClusterIP Service (
echo-service-svc) in front of the Pod. The Service provides a fixed cluster-internal DNS name and load-balances traffic to the Pod. It accepts requests on port8080and forwards them to the container’s port8080. -
The echo service must not be accessible from outside the cluster. A ClusterIP Service has no external port and no route from outside the cluster network, so it satisfies this requirement by design. No Gateway, Ingress, or NodePort is needed.

The diagram shows the resulting architecture: external clients have no path into the application, while internal services reach the echo service through the ClusterIP Service, which forwards traffic into the Pod managed by the Deployment.
3.5.2 Implementation
We start by creating a Deployment with a single replica (the default). The task allows short periods of unavailability, so one instance is enough. We use the jmalloc/echo-server:0.3.7 image and declare that the container listens on port 8080. The kubectl create deployment command automatically adds the label app=echo-service to the Pods, which will be useful later when we create the Service.
kubectl create deployment echo-service \
    --image=jmalloc/echo-server:0.3.6 \
    --port=8080
To inspect the YAML that would be applied without actually creating the resource, use the --dry-run=client -o yaml flags:
kubectl create deployment echo-service \
    --image=jmalloc/echo-server:0.3.6 \
    --port=8080 \
    --dry-run=client -o yaml
The output should look similar to this:
apiVersion: apps/v1
kind: Deployment
metadata:
  creationTimestamp: null
  labels:
    app: echo-service
  name: echo-service
spec:
  replicas: 1
  selector:
    matchLabels:
      app: echo-service
  strategy: {}
  template:
    metadata:
      creationTimestamp: null
      labels:
        app: echo-service
    spec:
      containers:
      - image: jmalloc/echo-server:0.3.6
        name: echo-server
        ports:
        - containerPort: 8080
        resources: {}
status: {}
Next, we expose the Deployment as a ClusterIP Service. ClusterIP is the right choice here because it gives other services inside the cluster a stable address for reaching the echo service while keeping it inaccessible from outside.
We use kubectl expose instead of creating the Service manually with kubectl create service clusterip because it automatically sets the selector to match the Deployment Pods, which is exactly the wiring we need. The Service listens on port 8080 and forwards traffic to the container port 8080.
kubectl expose deployment echo-service \
    --name=echo-service-svc \
    --type=ClusterIP \
    --port=8080 \
    --target-port=8080
3.5.2.1 Verify resource creation
To verify that the Pod is running, execute the following command, which filters Pods by the app=echo-service label automatically set by kubectl create deployment:
kubectl get pods -l app=echo-service
The output should look similar to this:
NAME                            READY   STATUS    RESTARTS   AGE
echo-service-5b7d9f6c48-m6k3p   1/1     Running   0          7m
To verify that the Service is configured correctly, run:
kubectl get svc echo-service-svc
The output should look similar to this:
NAME               TYPE        CLUSTER-IP      EXTERNAL-IP   PORT(S)    AGE
echo-service-svc   ClusterIP   10.107.54.221   <none>        8080/TCP   5m
From this output, we can confirm that internal access to the echo service is available at http://echo-service-svc:8080 and that external access is not possible, since no external IP is assigned.
3.5.2.2 Test the echo service
To test the echo service, create a temporary Pod using busybox:
kubectl run -it --rm --restart=Never busybox --image=busybox sh
Inside the busybox Pod, use wget to send a request to the echo service through the Service ClusterIP. The service should echo back the request details.
wget -qO- http://echo-service-svc:8080
The response should look similar to the example below:
Request served by echo-service-5b7d9f6c48-m6k3p

HTTP/1.1 GET /

Host: echo-service-svc:8080
User-Agent: Wget
Connection: close
4 Multi-container deployment
Design and deploy a Pod with sidecar containers and a service for internal access.
This category includes the following learning objectives:
- Understanding of Pods.
- Understanding of Deployments.
- Knowledge of multi-container pod patterns and container lifecycle.
- Understanding of shared volumes between containers.
4.1 Task 1: Design and deploy a web server with a logging sidecar
Your team needs an internal web server that serves a static page inside the cluster. The operations team also requires real-time visibility into the access logs of the web server without having to exec into the running container.
The web server must run as an nginx container. A second container running busybox must act as a logging sidecar that continuously reads the nginx access log and prints it to its own standard output.
The web server must be reachable from other services inside the cluster through a stable address, but it must not be accessible from outside the cluster.
4.1.1 Architectural design
The task requires two containers that share log data, brief downtime is acceptable, and the web server must be reachable only from inside the cluster. These constraints drive four design decisions:
-
A single Deployment with one replica is enough because the application needs two containers in the same Pod, the nginx web server and the busybox logging sidecar. The Deployment creates a ReplicaSet that manages the Pod. If the Pod crashes, the ReplicaSet recreates it automatically at the cost of a short period of unavailability, which the task explicitly allows.
-
The sidecar needs access to nginx’s access logs without execing into the nginx container. A volume mounted at
/var/log/nginxlocation in both containers solves this: nginx writes its access log to the shared volume, and the sidecar continuously reads it withtail -f, streaming entries to its own standard output. This keeps the two containers decoupled: each has a single responsibility and the shared volume acts as the data bridge between them. -
Other services need a stable address to reach the web server. Pod IPs change every time a Pod is recreated, so we place a ClusterIP Service (
nginx-sidecar-svc) in front of the Pod. The Service provides a fixed cluster-internal DNS name and forwards traffic to the nginx container on port80. -
The web server must not be accessible from outside the cluster. A ClusterIP Service has no external port and no route from outside the cluster network, so it satisfies this requirement by design. No Gateway, Ingress, or NodePort is needed.

The diagram shows the resulting architecture: external clients have no path into the application, while internal services reach the web server through the ClusterIP Service, which forwards traffic into the Pod managed by the Deployment. Inside the Pod, the nginx container serves requests and writes access logs to a shared volume, which the logging sidecar reads and streams to standard output.
4.1.2 Implementation
Unlike single-container Pods, multi-container Pods cannot be created with kubectl create deployment alone. We need a YAML manifest to define both containers and the shared volume within the same Pod.
We start by creating a file called nginx-with-sidecar.yaml:
cat <<EOF > nginx-with-sidecar.yaml
With the following content:
apiVersion: apps/v1
kind: Deployment
metadata:
  name: nginx-with-sidecar
  labels:
    app: nginx-with-sidecar
spec:
  replicas: 1
  selector:
    matchLabels:
      app: nginx-with-sidecar
  template:
    metadata:
      labels:
        app: nginx-with-sidecar
    spec:
      containers:
        - name: nginx
          image: nginx:1.27
          ports:
            - containerPort: 80
          volumeMounts:
            - name: logs
              mountPath: /var/log/nginx
        - name: log-sidecar
          image: busybox:1.37
          command:
            - sh
            - -c
            - tail -f /var/log/nginx/access.log
          volumeMounts:
            - name: logs
              mountPath: /var/log/nginx
      volumes:
        - name: logs
          emptyDir: {}
EOF
There are a few things to note in this manifest:
- Shared volume: An
emptyDirvolume calledlogsis mounted at/var/log/nginxin both containers. This is how the sidecar reads the log files written by nginx. AnemptyDirvolume is created when the Pod is assigned to a node and exists as long as the Pod is running on that node, making it ideal for sharing temporary data between containers in the same Pod. - Sidecar container: The
log-sidecarcontainer runstail -fon the nginx access log. This means it will continuously stream new log entries to its standard output, where they can be read withkubectl logs. - Single replica: One replica is enough since brief unavailability is acceptable.
To verify the file was created correctly, run:
cat nginx-with-sidecar.yaml
Apply the manifest to create the Deployment:
kubectl apply -f nginx-with-sidecar.yaml
Next, we expose the Deployment as a ClusterIP Service. The Service listens on port 80 and forwards traffic to the nginx container port 80.
kubectl expose deployment nginx-with-sidecar \
    --name=nginx-sidecar-svc \
    --type=ClusterIP \
    --port=80 \
    --target-port=80
4.1.2.1 Verify resource creation
To verify that the Pod is running and that both containers are ready, execute the following command:
kubectl get pods -l app=nginx-with-sidecar --watch
The output should look similar to this. Notice that the READY column shows 2/2, confirming that both the nginx container and the log-sidecar container are running:
NAME                                  READY   STATUS    RESTARTS   AGE
nginx-with-sidecar-5d4f7b8c9a-k2m8n   2/2     Running   0          2m
To verify that the Service is configured correctly, run:
kubectl get svc nginx-sidecar-svc
The output should look similar to this:
NAME                TYPE        CLUSTER-IP      EXTERNAL-IP   PORT(S)   AGE
nginx-sidecar-svc   ClusterIP   10.96.145.203   <none>        80/TCP    1m
4.1.2.2 Test the web server
To test the web server, create a temporary Pod and send a request through the Service:
kubectl run -it --rm --restart=Never busybox --image=busybox sh
Inside the busybox Pod, use wget to access the web server through the Service ClusterIP:
wget -qO- http://nginx-sidecar-svc
The response should be the default nginx welcome page:
<!DOCTYPE html>
<html>
    <head>
        <title>Welcome to nginx!</title>
        <!-- CSS styles omitted for brevity -->
    </head>
    <body>
        <h1>Welcome to nginx!</h1>
        <p>If you see this page, the nginx web server is successfully installed and
        working. Further configuration is required.</p>
        <!-- Content omitted for brevity -->
    </body>
</html>
4.1.2.3 Verify the sidecar logs
After sending the request above, exit the busybox Pod and verify that the sidecar captured the access log entry. First, get the Pod name:
POD_NAME=$(kubectl get pods \
    -l app=nginx-with-sidecar \
    -o jsonpath='{.items[0].metadata.name}') \
&& echo $POD_NAME
Then, read the logs from the log-sidecar container using the -c flag to specify which container to read from:
kubectl logs $POD_NAME -c log-sidecar
The output should show the access log entry from the request we made through the busybox Pod:
10.244.0.12 - - [05/Mar/2026:10:30:00 +0000] "GET / HTTP/1.1" 200 615 "-" "Wget"
This confirms that the sidecar pattern is working correctly: nginx writes logs to the shared volume, and the sidecar reads and exposes them through its standard output.
4.2 Task 2: Design and deploy a web server with an error monitoring sidecar
Your team needs an internal documentation portal that serves static content inside the cluster. The security team requires continuous monitoring of all error events generated by the web server for audit compliance, without modifying the web server configuration or accessing its container directly.
The web server must run as an httpd (Apache) container. A second container running busybox must act as an error monitoring sidecar that continuously reads the httpd error log and prints it to its own standard output.
The web server must be reachable from other services inside the cluster through a stable address, but it must not be accessible from outside the cluster.
4.2.1 Architectural design
The task requires two containers that share error log data, brief downtime is acceptable, and the web server must be reachable only from inside the cluster. These constraints drive four design decisions:
-
A single Deployment with one replica is enough because the application needs two containers in the same Pod, the httpd web server and the busybox error monitoring sidecar. The Deployment creates a ReplicaSet that manages the Pod. If the Pod crashes, the ReplicaSet recreates it automatically at the cost of a short period of unavailability, which the task explicitly allows.
-
The sidecar needs access to httpd’s error logs without execing into the httpd container. A volume mounted at
/usr/local/apache2/logslocation in both containers solves this: httpd writes its error log to the shared volume, and the sidecar continuously reads it withtail -f, streaming entries to its own standard output. This keeps the two containers decoupled: each has a single responsibility and the shared volume acts as the data bridge between them. -
Other services need a stable address to reach the web server. Pod IPs change every time a Pod is recreated, so we place a ClusterIP Service (
httpd-monitor-svc) in front of the Pod. The Service provides a fixed cluster-internal DNS name and forwards traffic to the httpd container on port80. -
The web server must not be accessible from outside the cluster. A ClusterIP Service has no external port and no route from outside the cluster network, so it satisfies this requirement by design. No Gateway, Ingress, or NodePort is needed.

The diagram shows the resulting architecture: external clients have no path into the application, while internal services reach the web server through the ClusterIP Service, which forwards traffic into the Pod managed by the Deployment. Inside the Pod, the httpd container serves requests and writes error logs to a shared volume, which the error monitoring sidecar reads and streams to standard output.
4.2.2 Implementation
Unlike single-container Pods, multi-container Pods cannot be created with kubectl create deployment alone. We need a YAML manifest to define both containers and the shared volume within the same Pod.
We start by creating a file called httpd-with-monitor.yaml:
cat <<EOF > httpd-with-monitor.yaml
With the following content:
apiVersion: apps/v1
kind: Deployment
metadata:
  name: httpd-with-monitor
  labels:
    app: httpd-with-monitor
spec:
  replicas: 1
  selector:
    matchLabels:
      app: httpd-with-monitor
  template:
    metadata:
      labels:
        app: httpd-with-monitor
    spec:
      containers:
        - name: httpd
          image: httpd:2.4
          command:
            - sh
            - -c
            - |
              sed -i 's|ErrorLog /proc/self/fd/2|ErrorLog logs/error_log|' \
                /usr/local/apache2/conf/httpd.conf
              httpd-foreground
          ports:
            - containerPort: 80
          volumeMounts:
            - name: logs
              mountPath: /usr/local/apache2/logs
        - name: error-monitor
          image: busybox:1.37
          command:
            - sh
            - -c
            - |
              until [ -f /usr/local/apache2/logs/error_log ]; do sleep 1; done
              tail -f /usr/local/apache2/logs/error_log
          volumeMounts:
            - name: logs
              mountPath: /usr/local/apache2/logs
      volumes:
        - name: logs
          emptyDir: {}
EOF
There are a few things to note in this manifest:
- Shared volume: An
emptyDirvolume calledlogsis mounted at/usr/local/apache2/logsin both containers. This is how the sidecar reads the log files written by httpd. AnemptyDirvolume is created when the Pod is assigned to a node and exists as long as the Pod is running on that node, making it ideal for sharing temporary data between containers in the same Pod. - httpd command override: The official
httpd:2.4Docker image configuresErrorLog /proc/self/fd/2, which redirects error logs to stderr instead of writing them to a file. The sidecar reads from the shared volume, so it needs a file. The httpd container’s command usessedto rewrite that directive toErrorLog logs/error_logbefore startinghttpd-foreground, making httpd write error logs to the shared volume where the sidecar can read them. - Sidecar container: The
error-monitorcontainer first waits forerror_logto exist as httpd only creates the file on startup, and theemptyDirvolume starts empty, sotail -fwould fail immediately without this guard. Once the file appears, it continuously streams new log entries to its standard output, where they can be read withkubectl logs. - Single replica: One replica is enough since brief unavailability is acceptable.
To verify the file was created correctly, run:
cat httpd-with-monitor.yaml
Apply the manifest to create the Deployment:
kubectl apply -f httpd-with-monitor.yaml
Next, we expose the Deployment as a ClusterIP Service. The Service listens on port 80 and forwards traffic to the httpd container port 80.
kubectl expose deployment httpd-with-monitor \
    --name=httpd-monitor-svc \
    --type=ClusterIP \
    --port=80 \
    --target-port=80
4.2.2.1 Verify resource creation
To verify that the Pod is running and that both containers are ready, execute the following command:
kubectl get pods -l app=httpd-with-monitor --watch
The output should look similar to this. Notice that the READY column shows 2/2, confirming that both the httpd container and the error-monitor container are running:
NAME                                  READY   STATUS    RESTARTS   AGE
httpd-with-monitor-6b7f9c2d1e-x4p3q   2/2     Running   0          2m
To verify that the Service is configured correctly, run:
kubectl get svc httpd-monitor-svc
The output should look similar to this:
NAME                TYPE        CLUSTER-IP      EXTERNAL-IP   PORT(S)   AGE
httpd-monitor-svc   ClusterIP   10.96.178.42    <none>        80/TCP    1m
4.2.2.2 Test the web server
To test the web server, create a temporary Pod and send a request through the Service:
kubectl run -it --rm --restart=Never busybox --image=busybox sh
Inside the busybox Pod, use wget to access the web server through the Service ClusterIP:
wget -qO- http://httpd-monitor-svc
The response should be the default Apache welcome page:
<html>
    <body>
        <h1>It works!</h1>
    </body>
</html>
4.2.2.3 Verify the sidecar logs
After sending the request above, exit the busybox Pod and verify that the sidecar captured the error log entries. First, get the Pod name:
POD_NAME=$(kubectl get pods \
    -l app=httpd-with-monitor \
    -o jsonpath='{.items[0].metadata.name}') \
&& echo $POD_NAME
Then, read the logs from the error-monitor container using the -c flag to specify which container to read from:
kubectl logs $POD_NAME -c error-monitor
The output should show error log entries from the httpd server, including startup messages and any request processing events:
[Wed Mar 05 10:30:00.000000 2026] [mpm_event:notice] [pid 1:tid 1] AH00489: Apache/2.4.62 (Unix) configured -- resuming normal operations
[Wed Mar 05 10:30:00.000000 2026] [core:notice] [pid 1:tid 1] AH00094: Command line: 'httpd -D FOREGROUND'
This confirms that the sidecar pattern is working correctly: httpd writes error logs to the shared volume, and the sidecar reads and exposes them through its standard output.
4.3 Task 3: Design and deploy a Java application server with an access logging sidecar
Your team needs an internal Java application server that hosts backend services inside the cluster. The platform team requires a dedicated stream of HTTP access logs from the application server for traffic analysis and capacity planning, without modifying the server configuration or accessing its container directly.
The application server must run as a tomcat container. A second container running busybox must act as an access logging sidecar that continuously reads the Tomcat access log and prints it to its own standard output.
The application server must be reachable from other services inside the cluster through a stable address, but it must not be accessible from outside the cluster.
4.3.1 Architectural design
The task requires two containers that share access log data, brief downtime is acceptable, and the application server must be reachable only from inside the cluster. These constraints drive four design decisions:
-
A single Deployment with one replica is enough because the application needs two containers in the same Pod, the Tomcat application server and the busybox access logging sidecar. The Deployment creates a ReplicaSet that manages the Pod. If the Pod crashes, the ReplicaSet recreates it automatically at the cost of a short period of unavailability, which the task explicitly allows.
-
The sidecar needs access to Tomcat’s access logs without execing into the Tomcat container. A volume mounted at
/usr/local/tomcat/logslocation in both containers solves this: Tomcat writes its access log to the shared volume, and the sidecar continuously reads it withtail -f, streaming entries to its own standard output. This keeps the two containers decoupled: each has a single responsibility and the shared volume acts as the data bridge between them. -
Other services need a stable address to reach the application server. Pod IPs change every time a Pod is recreated, so we place a ClusterIP Service (
tomcat-logger-svc) in front of the Pod. The Service provides a fixed cluster-internal DNS name and forwards traffic on port80to the Tomcat container on port8080. -
The application server must not be accessible from outside the cluster. A ClusterIP Service has no external port and no route from outside the cluster network, so it satisfies this requirement by design. No Gateway, Ingress, or NodePort is needed.

The diagram shows the resulting architecture: external clients have no path into the application, while internal services reach the application server through the ClusterIP Service, which forwards traffic into the Pod managed by the Deployment. Inside the Pod, the Tomcat container serves requests and writes access logs to a shared volume, which the access logging sidecar reads and streams to standard output.
4.3.2 Implementation
Unlike single-container Pods, multi-container Pods cannot be created with kubectl create deployment alone. We need a YAML manifest to define both containers and the shared volume within the same Pod.
We start by creating a file called tomcat-with-logger.yaml:
cat <<EOF > tomcat-with-logger.yaml
With the following content:
apiVersion: apps/v1
kind: Deployment
metadata:
  name: tomcat-with-logger
  labels:
    app: tomcat-with-logger
spec:
  replicas: 1
  selector:
    matchLabels:
      app: tomcat-with-logger
  template:
    metadata:
      labels:
        app: tomcat-with-logger
    spec:
      containers:
        - name: tomcat
          image: tomcat:11.0-jre21
          ports:
            - containerPort: 8080
          readinessProbe:
            tcpSocket:
              port: 8080
            initialDelaySeconds: 30
            periodSeconds: 5
          volumeMounts:
            - name: logs
              mountPath: /usr/local/tomcat/logs
        - name: access-logger
          image: busybox:1.37
          command:
            - sh
            - -c
            - |
              until ls /usr/local/tomcat/logs/localhost_access_log.*.txt 1>/dev/null 2>&1; do
                sleep 1
              done
              tail -f /usr/local/tomcat/logs/localhost_access_log.*.txt
          volumeMounts:
            - name: logs
              mountPath: /usr/local/tomcat/logs
      volumes:
        - name: logs
          emptyDir: {}
EOF
There are a few things to note in this manifest:
- Shared volume: An
emptyDirvolume calledlogsis mounted at/usr/local/tomcat/logsin both containers. This is how the sidecar reads the log files written by Tomcat. AnemptyDirvolume is created when the Pod is assigned to a node and exists as long as the Pod is running on that node, making it ideal for sharing temporary data between containers in the same Pod. - Sidecar container: The
access-loggercontainer waits for the access log file to appear, then runstail -fon it. Tomcat names its access log files with a date suffix (e.g.,localhost_access_log.2026-03-26.txt), so the sidecar uses a wildcard pattern to match the current file. This means it will continuously stream new log entries to its standard output, where they can be read withkubectl logs. - Port mapping: Tomcat listens on port
8080by default, unlike nginx or httpd which listen on port80. The Service will map external port80to the container’s port8080, so internal clients can reach it on the standard HTTP port. - Readiness probe: Tomcat is a JVM-based server and takes longer to start than nginx or httpd. Without a readiness probe, the Pod transitions to
Runningbefore Tomcat is actually accepting connections, causing connection failures. ThetcpSocketprobe with a 30-second initial delay prevents the Service from routing traffic until Tomcat is ready. - Single replica: One replica is enough since brief unavailability is acceptable.
To verify the file was created correctly, run:
cat tomcat-with-logger.yaml
Apply the manifest to create the Deployment:
kubectl apply -f tomcat-with-logger.yaml
Next, we expose the Deployment as a ClusterIP Service. The Service listens on port 80 and forwards traffic to the Tomcat container port 8080.
kubectl expose deployment tomcat-with-logger \
    --name=tomcat-logger-svc \
    --type=ClusterIP \
    --port=80 \
    --target-port=8080
4.3.2.1 Verify resource creation
To verify that the Pod is running and that both containers are ready, execute the following command:
kubectl get pods -l app=tomcat-with-logger --watch
The output should look similar to this. Notice that the READY column shows 2/2, confirming that both the Tomcat container and the access-logger container are running. Because Tomcat is a JVM-based server, it may take up to a minute before the Pod becomes fully ready. Wait until READY shows 2/2 before proceeding:
NAME                                  READY   STATUS    RESTARTS   AGE
tomcat-with-logger-4a9e1c7d3b-m6n2p   2/2     Running   0          2m
To verify that the Service is configured correctly, run:
kubectl get svc tomcat-logger-svc
The output should look similar to this:
NAME                TYPE        CLUSTER-IP      EXTERNAL-IP   PORT(S)   AGE
tomcat-logger-svc   ClusterIP   10.96.211.58    <none>        80/TCP    1m
4.3.2.2 Test the application server
To test the application server, create a temporary Pod and send a request through the Service:
kubectl run -it --rm --restart=Never busybox --image=busybox sh
Inside the busybox Pod, use wget to access the application server through the Service ClusterIP:
wget -qO- http://tomcat-logger-svc
The response should be HTTP 404 page by default as no web application is deployed.
4.3.2.3 Verify the sidecar logs
After sending the request above, exit the busybox Pod and verify that the sidecar captured the access log entry. First, get the Pod name:
POD_NAME=$(kubectl get pods \
    -l app=tomcat-with-logger \
    -o jsonpath='{.items[0].metadata.name}') \
&& echo $POD_NAME
Then, read the logs from the access-logger container using the -c flag to specify which container to read from:
kubectl logs $POD_NAME -c access-logger
The output should show the access log entry from the request we made through the busybox Pod:
10.244.0.15 - - [26/Mar/2026:10:30:00 +0000] "GET / HTTP/1.1" 404 762
This confirms that the sidecar pattern is working correctly: Tomcat writes access logs to the shared volume, and the sidecar reads and exposes them through its standard output.
4.4 Task 4: Design and deploy a web server with a log adapter sidecar
Your team needs an internal web server that serves static content inside the cluster. The analytics team needs the access logs delivered in CSV format so they can ingest them directly into their data pipeline, but the web server produces logs in Common Log Format (CLF). The log format must be converted without modifying the web server configuration or accessing its container directly.
The web server must run as an httpd (Apache) container. A second container running busybox must act as a log adapter sidecar that continuously reads the httpd access log in Common Log Format, transforms each entry into CSV (ip,timestamp,method,path,status), and prints the result to its own standard output.
The web server must be reachable from other services inside the cluster through a stable address, but it must not be accessible from outside the cluster.
4.4.1 Architectural design
The task requires two containers where the sidecar transforms log data from one format to another, brief downtime is acceptable, and the web server must be reachable only from inside the cluster. These constraints drive four design decisions:
-
A single Deployment with one replica is enough because the application needs two containers in the same Pod, the httpd web server and the busybox log adapter sidecar. The Deployment creates a ReplicaSet that manages the Pod. If the Pod crashes, the ReplicaSet recreates it automatically at the cost of a short period of unavailability, which the task explicitly allows.
-
The sidecar needs to read httpd’s access logs and transform them from Common Log Format to CSV without execing into the httpd container. A volume mounted at
/usr/local/apache2/logslocation in both containers solves this: httpd writes its access log in Common Log Format to the shared volume, and the sidecar continuously reads it withtail -f, pipes each line throughawkto extract the relevant fields, and outputs the result as CSV to its own standard output. This is the adapter pattern: the sidecar converts data from the format the main container produces into the format downstream consumers expect. The shared volume acts as the data bridge between them. -
Other services need a stable address to reach the web server. Pod IPs change every time a Pod is recreated, so we place a ClusterIP Service (
httpd-adapter-svc) in front of the Pod. The Service provides a fixed cluster-internal DNS name and forwards traffic to the httpd container on port80. -
The web server must not be accessible from outside the cluster. A ClusterIP Service has no external port and no route from outside the cluster network, so it satisfies this requirement by design. No Gateway, Ingress, or NodePort is needed.

The diagram shows the resulting architecture: external clients have no path into the application, while internal services reach the web server through the ClusterIP Service, which forwards traffic into the Pod managed by the Deployment. Inside the Pod, the httpd container serves requests and writes access logs in Common Log Format to a shared volume, which the log adapter sidecar reads, transforms to CSV, and streams to standard output.
4.4.2 Implementation
Unlike single-container Pods, multi-container Pods cannot be created with kubectl create deployment alone. We need a YAML manifest to define both containers and the shared volume within the same Pod.
We start by creating a file called httpd-with-adapter.yaml:
cat <<EOF > httpd-with-adapter.yaml
With the following content:
apiVersion: apps/v1
kind: Deployment
metadata:
  name: httpd-with-adapter
  labels:
    app: httpd-with-adapter
spec:
  replicas: 1
  selector:
    matchLabels:
      app: httpd-with-adapter
  template:
    metadata:
      labels:
        app: httpd-with-adapter
    spec:
      containers:
        - name: httpd
          image: httpd:2.4
          command:
            - sh
            - -c
            - |
              sed -i 's|CustomLog /proc/self/fd/1 common|CustomLog logs/access_log common|' \
                /usr/local/apache2/conf/httpd.conf
              httpd-foreground
          ports:
            - containerPort: 80
          volumeMounts:
            - name: logs
              mountPath: /usr/local/apache2/logs
        - name: log-adapter
          image: busybox:1.37
          command:
            - sh
            - -c
            - |
              until [ -f /usr/local/apache2/logs/access_log ]; do sleep 1; done
              tail -f /usr/local/apache2/logs/access_log | \
                awk 'BEGIN{OFS=","} {print $1,substr($4,2),substr($6,2),$7,$9; fflush()}'
          volumeMounts:
            - name: logs
              mountPath: /usr/local/apache2/logs
      volumes:
        - name: logs
          emptyDir: {}
EOF
There are a few things to note in this manifest:
- Shared volume: An
emptyDirvolume calledlogsis mounted at/usr/local/apache2/logsin both containers. This is how the sidecar reads the log files written by httpd. AnemptyDirvolume is created when the Pod is assigned to a node and exists as long as the Pod is running on that node, making it ideal for sharing temporary data between containers in the same Pod. - httpd command override: The official
httpd:2.4Docker image configuresCustomLog /proc/self/fd/1 common, which redirects access logs to stdout instead of writing them to a file. The sidecar reads from the shared volume, so it needs a file. The httpd container’s command usessedto rewrite that directive toCustomLog logs/access_log commonbefore startinghttpd-foreground, making httpd write access logs to the shared volume where the sidecar can read them. - Adapter sidecar: The
log-adaptercontainer first waits foraccess_logto exist — httpd only creates the file on the first request, and theemptyDirvolume starts empty, sotail -fwould fail immediately without this guard. Once the file appears, it runstail -fpiped into a single-lineawkcommand.BEGIN{OFS=","}sets the output field separator to a comma, so theprintstatement separates each field with a comma automatically.substr($4,2)strips the leading[from the timestamp field, andsubstr($6,2)strips the leading"from the HTTP method. Thefflush()call forcesawkto flush its output buffer on every line — without it,kubectl logswould show nothing until the buffer fills up. This is the adapter pattern: the sidecar transforms data from the format the main container produces (CLF) into the format downstream consumers need (CSV). - Single replica: One replica is enough since brief unavailability is acceptable.
To verify the file was created correctly, run:
cat httpd-with-adapter.yaml
Apply the manifest to create the Deployment:
kubectl apply -f httpd-with-adapter.yaml
Next, we expose the Deployment as a ClusterIP Service. The Service listens on port 80 and forwards traffic to the httpd container port 80.
kubectl expose deployment httpd-with-adapter \
    --name=httpd-adapter-svc \
    --type=ClusterIP \
    --port=80 \
    --target-port=80
4.4.2.1 Verify resource creation
To verify that the Pod is running and that both containers are ready, execute the following command:
kubectl get pods -l app=httpd-with-adapter --watch
The output should look similar to this. Notice that the READY column shows 2/2, confirming that both the httpd container and the log-adapter container are running:
NAME                                  READY   STATUS    RESTARTS   AGE
httpd-with-adapter-7c8d3e5f2a-r9k1w   2/2     Running   0          2m
To verify that the Service is configured correctly, run:
kubectl get svc httpd-adapter-svc
The output should look similar to this:
NAME                TYPE        CLUSTER-IP      EXTERNAL-IP   PORT(S)   AGE
httpd-adapter-svc   ClusterIP   10.96.192.71    <none>        80/TCP    1m
4.4.2.2 Test the web server
To test the web server, create a temporary Pod and send a request through the Service:
kubectl run -it --rm --restart=Never busybox --image=busybox sh
Inside the busybox Pod, use wget to access the web server through the Service ClusterIP:
wget -qO- http://httpd-adapter-svc
The response should be the default Apache welcome page:
<html>
    <body>
        <h1>It works!</h1>
    </body>
</html>
4.4.2.3 Verify the adapter output
After sending the request above, exit the busybox Pod and verify that the adapter sidecar transformed the log entry. First, get the Pod name:
POD_NAME=$(kubectl get pods \
    -l app=httpd-with-adapter \
    -o jsonpath='{.items[0].metadata.name}') \
&& echo $POD_NAME
Then, read the logs from the log-adapter container using the -c flag to specify which container to read from:
kubectl logs $POD_NAME -c log-adapter
The output should show the access log entry transformed from httpd’s native Common Log Format into CSV. Instead of the raw CLF:
10.244.0.12 - - [26/Mar/2026:10:30:00 +0000] "GET / HTTP/1.1" 200 45
The adapter sidecar outputs:
10.244.0.12,26/Mar/2026:10:30:00,GET,/,200
This confirms that the adapter pattern is working correctly: httpd writes access logs in Common Log Format to the shared volume, and the adapter sidecar reads them, extracts the relevant fields, and outputs them as CSV to its standard output for downstream consumers.
4.5 Task 5: Design and deploy a web server with a content sync sidecar
Your team needs an internal status page that displays up-to-date system information inside the cluster. The content must refresh automatically every 30 seconds without restarting the web server. The operations team wants the page to show the current timestamp and hostname so they can verify the content is being updated.
The web server must run as an nginx container that serves whatever HTML files are present in its document root. A second container running busybox must act as a content sync sidecar that regenerates an HTML status page every 30 seconds and writes it to a shared volume where nginx can serve it.
The web server must be reachable from other services inside the cluster through a stable address, but it must not be accessible from outside the cluster.
4.5.1 Architectural design
The task requires two containers that share content data, brief downtime is acceptable, and the web server must be reachable only from inside the cluster. These constraints drive four design decisions:
-
A single Deployment with one replica is enough because the application needs two containers in the same Pod, the nginx web server and the busybox content sync sidecar. The Deployment creates a ReplicaSet that manages the Pod. If the Pod crashes, the ReplicaSet recreates it automatically at the cost of a short period of unavailability, which the task explicitly allows.
-
The sidecar needs to provide fresh content to nginx without modifying the nginx container or its configuration. A volume mounted at
/usr/share/nginx/htmlin both containers solves this: the sidecar writes anindex.htmlfile to the shared volume every 30 seconds, and nginx serves it to incoming requests. This reverses the typical sidecar data flow: instead of the sidecar reading from the main container, the sidecar writes content that the main container serves. The shared volume acts as the data bridge between them. -
Other services need a stable address to reach the web server. Pod IPs change every time a Pod is recreated, so we place a ClusterIP Service (
nginx-content-svc) in front of the Pod. The Service provides a fixed cluster-internal DNS name and forwards traffic to the nginx container on port80. -
The web server must not be accessible from outside the cluster. A ClusterIP Service has no external port and no route from outside the cluster network, so it satisfies this requirement by design. No Gateway, Ingress, or NodePort is needed.
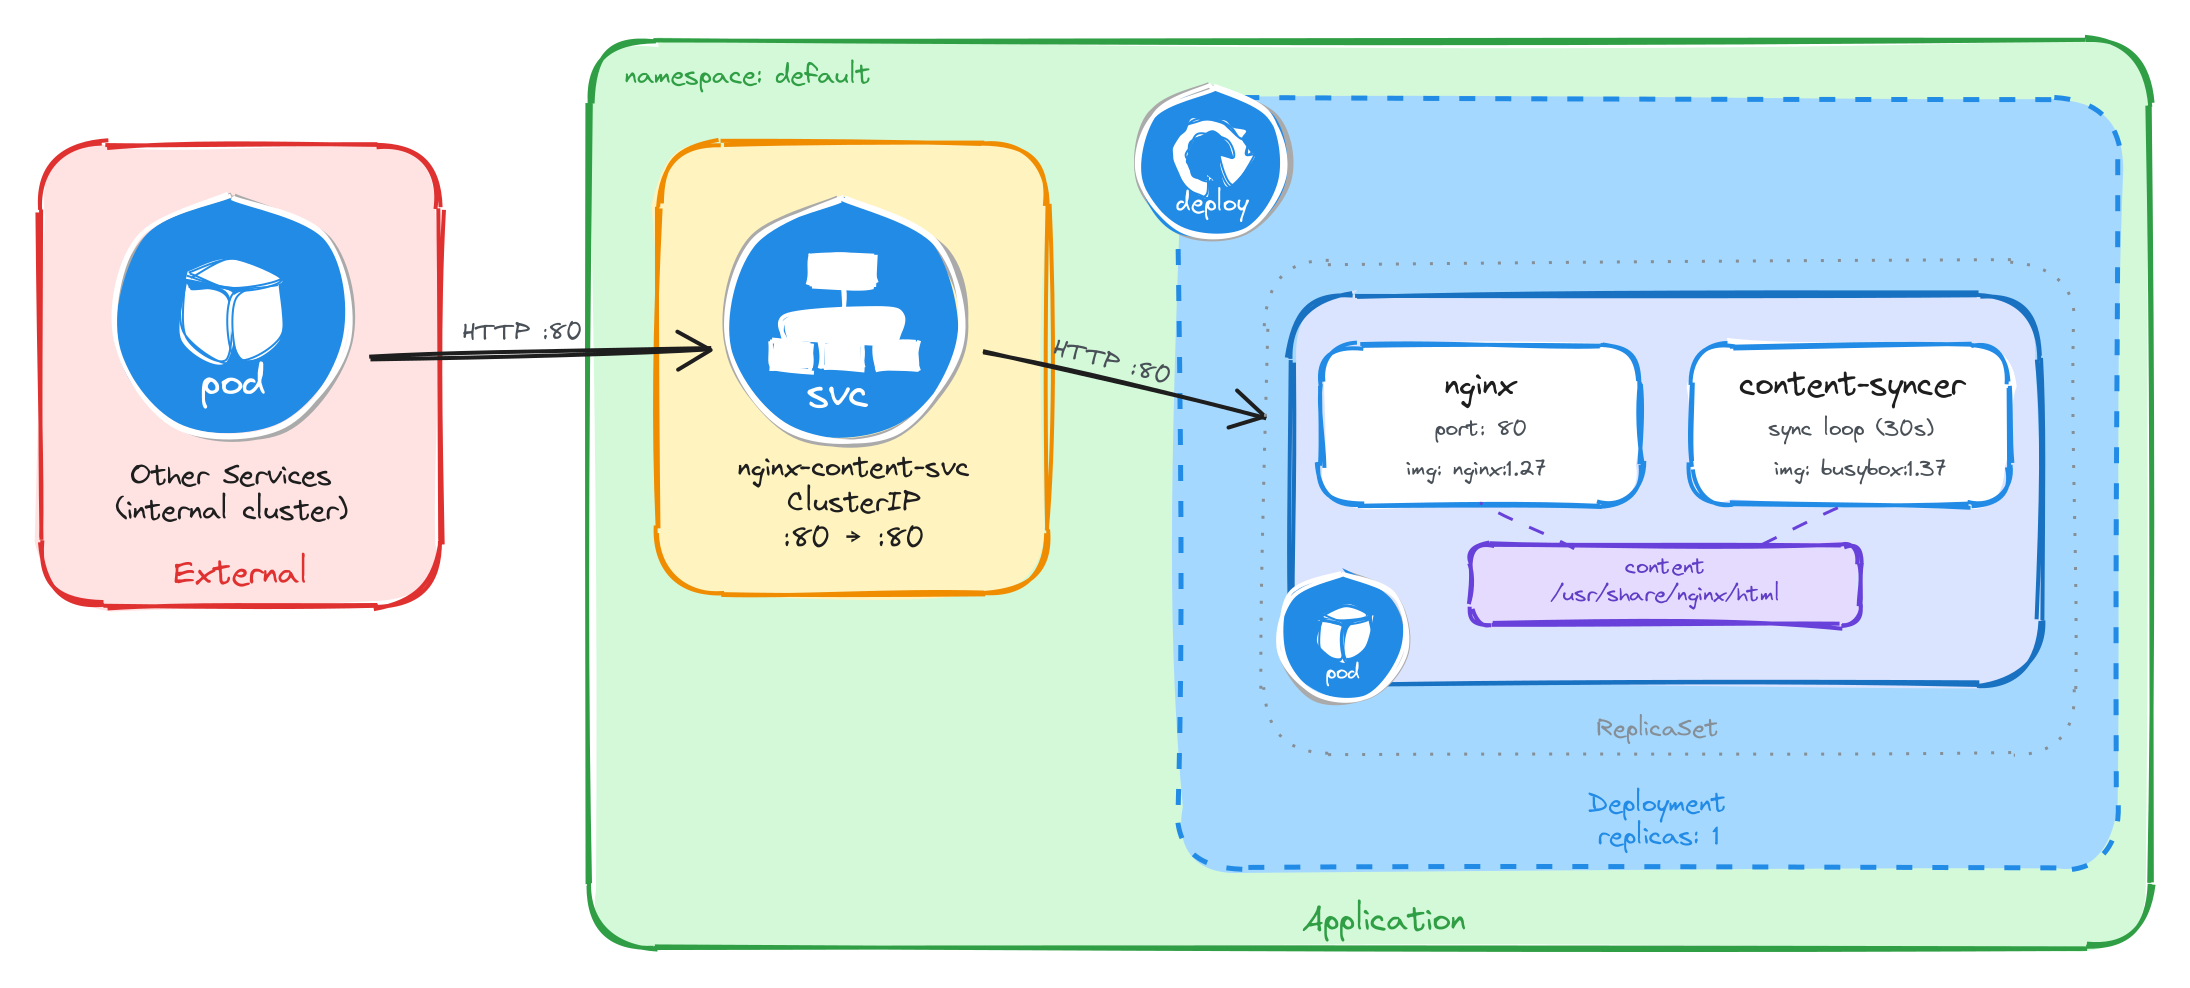
The diagram shows the resulting architecture: external clients have no path into the application, while internal services reach the web server through the ClusterIP Service, which forwards traffic into the Pod managed by the Deployment. Inside the Pod, the content sync sidecar regenerates the HTML status page every 30 seconds and writes it to a shared volume, which nginx reads and serves to clients.
4.5.2 Implementation
Unlike single-container Pods, multi-container Pods cannot be created with kubectl create deployment alone. We need a YAML manifest to define both containers and the shared volume within the same Pod.
We start by creating a file called nginx-with-syncer.yaml:
cat <<'EOF' > nginx-with-syncer.yaml
With the following content:
apiVersion: apps/v1
kind: Deployment
metadata:
  name: nginx-with-syncer
  labels:
    app: nginx-with-syncer
spec:
  replicas: 1
  selector:
    matchLabels:
      app: nginx-with-syncer
  template:
    metadata:
      labels:
        app: nginx-with-syncer
    spec:
      containers:
        - name: nginx
          image: nginx:1.27
          ports:
            - containerPort: 80
          volumeMounts:
            - name: content
              mountPath: /usr/share/nginx/html
        - name: content-syncer
          image: busybox:1.37
          command:
            - sh
            - -c
            - |
              while true; do
                echo "<html><head><title>Status Page</title></head><body><h1>System Status</h1><p>Hostname: $(hostname)</p><p>Last updated: $(date -u)</p></body></html>" > /usr/share/nginx/html/index.html
                sleep 30
              done
          volumeMounts:
            - name: content
              mountPath: /usr/share/nginx/html
      volumes:
        - name: content
          emptyDir: {}
EOF
There are a few things to note in this manifest:
- Shared volume: An
emptyDirvolume calledcontentis mounted at/usr/share/nginx/htmlin both containers. This is how nginx serves the files written by the sidecar. AnemptyDirvolume is created when the Pod is assigned to a node and exists as long as the Pod is running on that node, making it ideal for sharing temporary data between containers in the same Pod. - Reversed data flow: Unlike the previous tasks where the sidecar reads data produced by the main container, here the sidecar writes content that the main container serves. This demonstrates that the sidecar pattern is flexible: the shared volume can carry data in either direction.
- Sidecar container: The
content-syncercontainer runs an infinite loop that regeneratesindex.htmlevery 30 seconds usingechowith$(hostname)and$(date -u)command substitutions. The shell evaluates these at runtime, producing the Pod’s actual hostname and the current UTC timestamp. This means every request to nginx will return a page that was updated at most 30 seconds ago. - Single replica: One replica is enough since brief unavailability is acceptable.
To verify the file was created correctly, run:
cat nginx-with-syncer.yaml
Apply the manifest to create the Deployment:
kubectl apply -f nginx-with-syncer.yaml
Next, we expose the Deployment as a ClusterIP Service. The Service listens on port 80 and forwards traffic to the nginx container port 80.
kubectl expose deployment nginx-with-syncer \
    --name=nginx-content-svc \
    --type=ClusterIP \
    --port=80 \
    --target-port=80
4.5.2.1 Verify resource creation
To verify that the Pod is running and that both containers are ready, execute the following command:
kubectl get pods -l app=nginx-with-syncer --watch
The output should look similar to this. Notice that the READY column shows 2/2, confirming that both the nginx container and the content-syncer container are running:
NAME                                 READY   STATUS    RESTARTS   AGE
nginx-with-syncer-3f8a2b6d4c-j7w5t   2/2     Running   0          2m
To verify that the Service is configured correctly, run:
kubectl get svc nginx-content-svc
The output should look similar to this:
NAME                TYPE        CLUSTER-IP      EXTERNAL-IP   PORT(S)   AGE
nginx-content-svc   ClusterIP   10.96.156.33    <none>        80/TCP    1m
4.5.2.2 Test the web server
To test the web server, create a temporary Pod and send a request through the Service:
kubectl run -it --rm --restart=Never busybox --image=busybox sh
Inside the busybox Pod, use wget to access the web server through the Service ClusterIP:
wget -qO- http://nginx-content-svc
The response should be the dynamically generated status page:
<html>
    <head><title>Status Page</title></head>
    <body>
        <h1>System Status</h1>
        <p>Hostname: nginx-with-syncer-3f8a2b6d4c-j7w5t</p>
        <p>Last updated: Wed Mar 26 10:30:00 UTC 2026</p>
    </body>
</html>
4.5.2.3 Verify the content refreshes
To confirm that the sidecar is regenerating the page, wait at least 30 seconds and send a second request from inside the busybox Pod:
sleep 35 && wget -qO- http://nginx-content-svc
The Last updated timestamp should be different from the first request, confirming that the content sync sidecar is continuously regenerating the page.
This confirms that the sidecar pattern is working correctly: the content-syncer writes fresh HTML to the shared volume every 30 seconds, and nginx serves it to clients.
5 Namespace-isolated deployment
Design and deploy the same application with its internal Service into separate Namespaces to simulate staging and production environments.
This category includes the following learning objectives:
- Understanding of Pods.
- Understanding of Deployments.
- Understanding of ClusterIP Services.
- Understanding of Namespace isolation, resource scoping, and deploying objects into specific Namespaces.
5.1 Task 1: Design and deploy a web application in staging and production namespaces
Your team needs to run the same internal web application in two isolated environments: staging and production. Each environment must be fully self-contained, with its own Deployment and Service, so that changes in one environment cannot affect the other.
The web application must run as a hello-kubernetes container, which displays the namespace it is running in, making it easy to confirm namespace isolation visually. It does not need to be highly resilient, since brief periods of unavailability are acceptable.
Other services within each namespace need a stable address to reach the web application, but it must not be accessible from outside the cluster.
5.1.1 Architectural design
The task requires running the same application in two isolated environments, brief downtime is acceptable, and the application must be reachable only from inside each namespace. These constraints drive four design decisions:
-
Two separate Namespaces (
stagingandproduction) provide the isolation boundary. Every Kubernetes resource is scoped to a Namespace, so Deployments, Pods, and Services created in one Namespace are invisible to the other. This lets both environments share the same resource names without conflict. -
Because the application is a single container and brief downtime is acceptable, a Deployment with one replica per Namespace is enough. Each Deployment creates its own ReplicaSet, which recreates the Pod automatically if it crashes, at the cost of a short period of unavailability that the task explicitly allows.
-
Other services within each Namespace need a stable address to reach the web application. Pod IPs change every time a Pod is recreated, so we place a ClusterIP Service (
web-app-svc) in front of the Pod in each Namespace. The Service provides a fixed cluster-internal DNS name and forwards traffic to the Pod. It accepts requests on port80and forwards them to the container’s port8080. -
The application must not be accessible from outside the cluster. A ClusterIP Service has no external port and no route from outside the cluster network, so it satisfies this requirement by design. No Gateway, Ingress, or NodePort is needed.
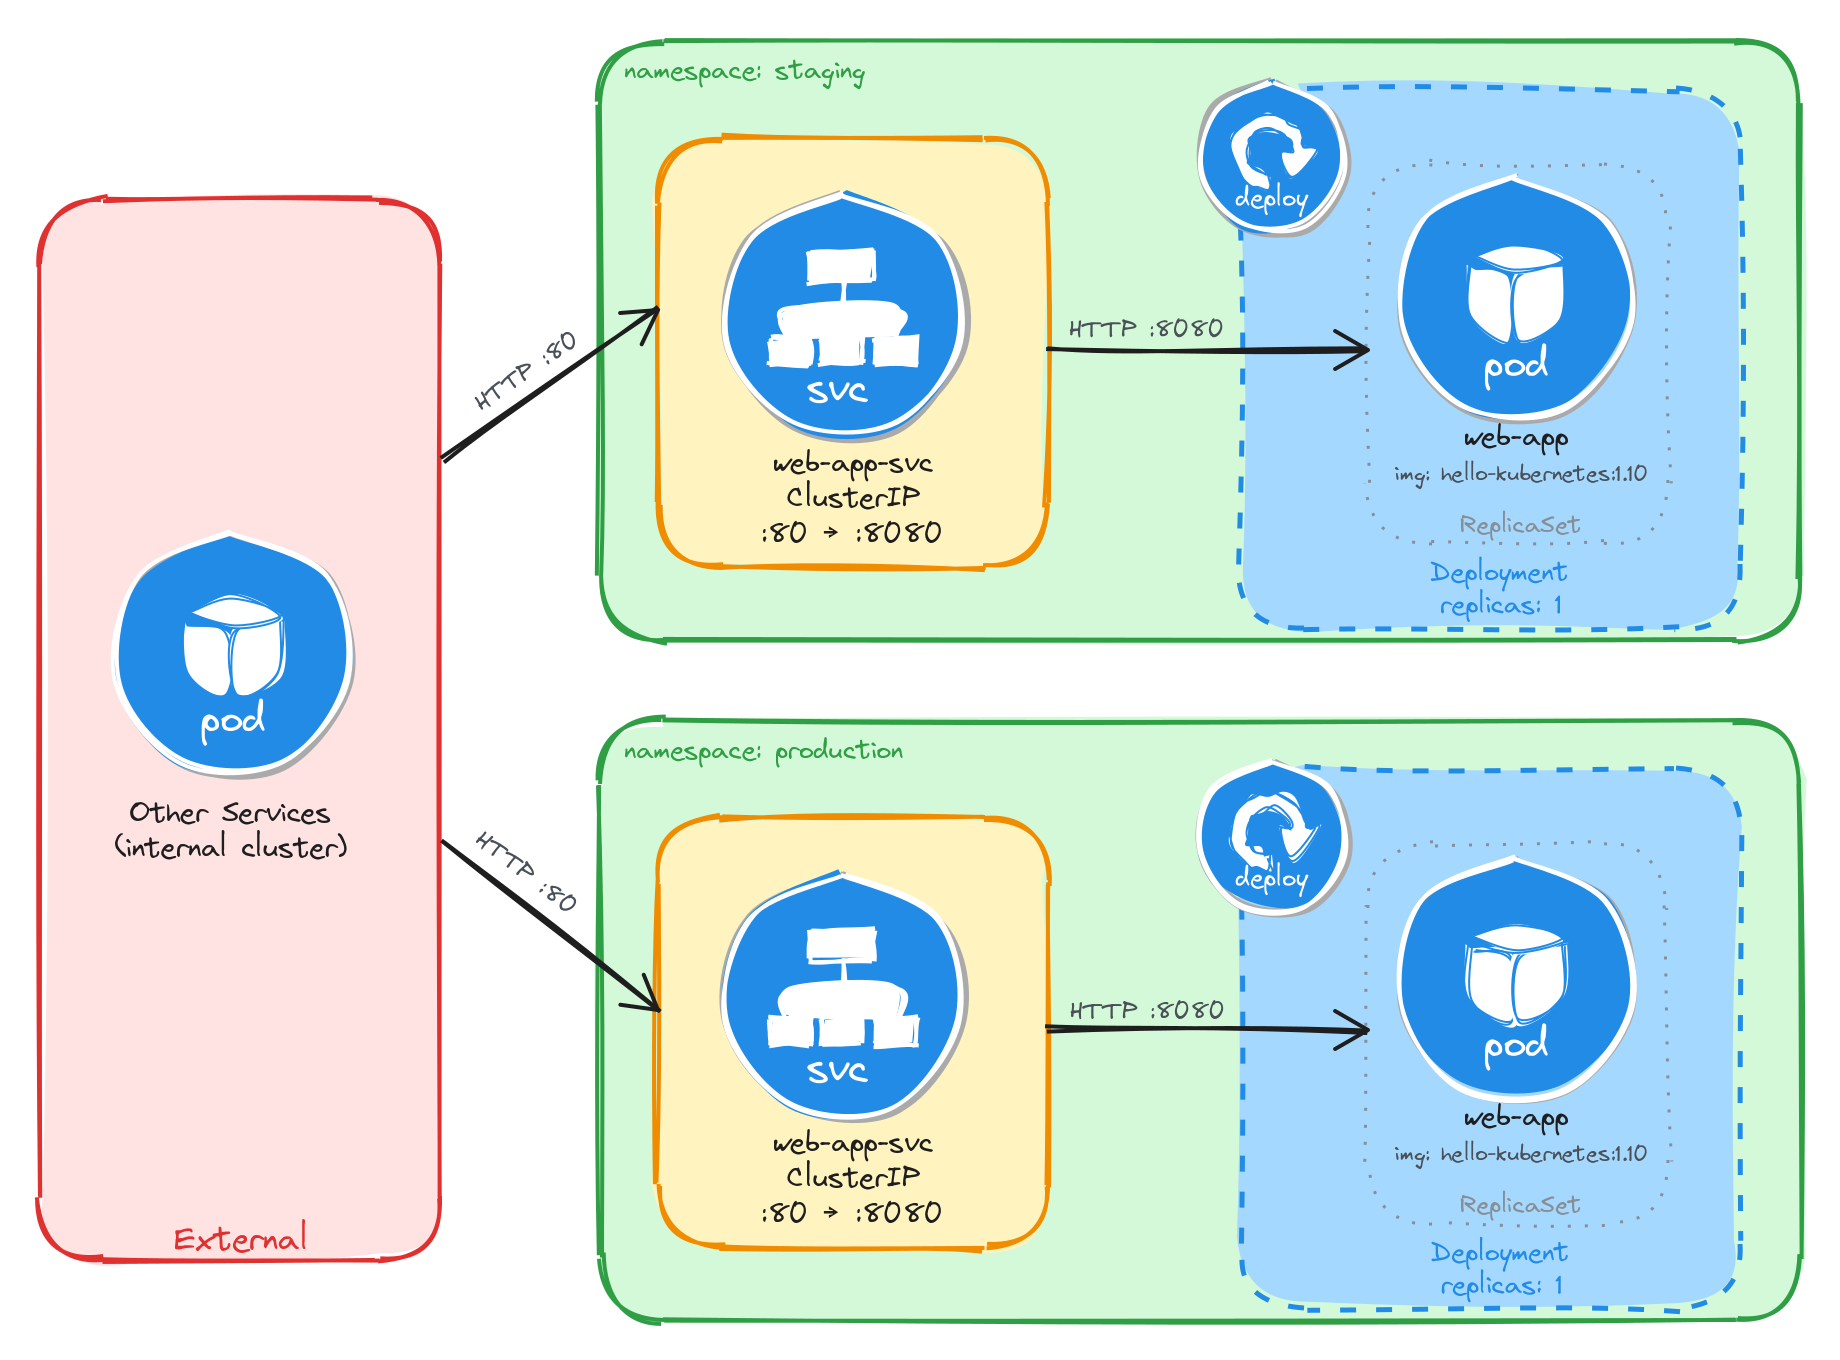
The diagram shows the resulting architecture: the staging and production Namespaces each contain an independent Deployment and ClusterIP Service with the same names. External clients have no path into either environment, while internal services reach the web application through the ClusterIP Service in their own Namespace. Cross-namespace access is possible only via the fully qualified DNS name (web-app-svc.<namespace>.svc.cluster.local), since short Service names resolve only within the same Namespace.
5.1.2 Implementation
We start by creating the two namespaces:
kubectl create namespace staging
kubectl create namespace production
Next, we create a file called web-app.yaml that will be reused for both environments:
cat <<EOF > web-app.yaml
With the following content:
apiVersion: apps/v1
kind: Deployment
metadata:
  name: web-app
  labels:
    app: web-app
spec:
  replicas: 1
  selector:
    matchLabels:
      app: web-app
  template:
    metadata:
      labels:
        app: web-app
    spec:
      containers:
        - name: hello-kubernetes
          image: paulbouwer/hello-kubernetes:1.10
          ports:
            - containerPort: 8080
          env:
            - name: KUBERNETES_NAMESPACE
              valueFrom:
                fieldRef:
                  fieldPath: metadata.namespace
EOF
The KUBERNETES_NAMESPACE environment variable is injected using the downward API, which allows a container to read its own Pod metadata at runtime. The hello-kubernetes application uses this variable to display the namespace in its response.
Notice that the manifest does not include a namespace field in the metadata. We will supply the target namespace at apply time using the -n flag, which lets us reuse the same manifest for both environments.
To verify the file was created correctly, run:
cat web-app.yaml
Apply the manifest to both namespaces:
kubectl apply -f web-app.yaml -n staging
kubectl apply -f web-app.yaml -n production
Next, we expose each Deployment as a ClusterIP Service inside its respective namespace:
kubectl expose deployment web-app \
    -n staging \
    --name=web-app-svc \
    --type=ClusterIP \
    --port=80 \
    --target-port=8080
kubectl expose deployment web-app \
    -n production \
    --name=web-app-svc \
    --type=ClusterIP \
    --port=80 \
    --target-port=8080
5.1.2.1 Verify resource creation
To verify that the Pods are running in each namespace, execute the following commands:
kubectl get pods -n staging -l app=web-app
kubectl get pods -n production -l app=web-app
The output for each should look similar to this:
NAME                          READY   STATUS    RESTARTS   AGE
web-app-6bfbf8b67c-m4t9x      1/1     Running   0          1m
To verify that the Services are configured correctly in each namespace, run:
kubectl get svc -n staging web-app-svc
kubectl get svc -n production web-app-svc
The output for each should look similar to this:
NAME             TYPE        CLUSTER-IP      EXTERNAL-IP   PORT(S)   AGE
web-app-svc      ClusterIP   10.96.112.54    <none>        80/TCP    1m
Note that the two Services share the same name (web-app-svc) but have different Cluster IPs, because they are independent resources in separate namespaces.
5.1.2.2 Test the web application
To test the staging web application, create a temporary Pod inside the staging namespace and send a request through the Service:
kubectl run -n staging -it --rm --restart=Never busybox --image=busybox -- sh
Inside the busybox Pod, use wget to access the web application through the Service:
wget -qO- http://web-app-svc
The response should be the hello-kubernetes HTML page showing the namespace the Pod is running in:
<!DOCTYPE html>
<html>
<head>
    <title>Hello Kubernetes!</title>
    <!-- CSS styles omitted for brevity -->
</head>
<body>
  <div class="main">
    <!-- Content omitted for brevity -->
    <div class="content">
      <div id="message">Hello world!</div>
      <div id="info">
        <table>
          <tr>
            <th>namespace:</th>
            <td>staging</td>
          </tr>
          <tr>
            <th>pod:</th>
            <td>web-app-67d9bd9d5d-n5t7g</td>
          </tr>
          <tr>
            <th>node:</th>
            <td>- (Linux 6.8.0-101-generic)</td>
          </tr>
        </table>
      </div>
    </div>
  </div>
</body>
</html>
To confirm that the response contains the correct namespace, run:
wget -qO- http://web-app-svc | grep -A1 'namespace'
The output should show the staging namespace:
<th>namespace:</th>
<td>staging</td>
Repeat the same test for the production namespace by running the busybox Pod with -n production. The grep output should show production instead of staging, confirming that each Deployment is running in its own isolated namespace.
5.1.2.3 Verify namespace isolation
To confirm that the short Service name does not resolve across namespaces, create a temporary Pod in the default namespace:
kubectl run -it --rm --restart=Never busybox --image=busybox -- sh
Inside this Pod, attempt to reach the staging web application using its short service name:
wget -qO- --timeout=5 http://web-app-svc
This fails because short Service names only resolve within the same namespace. Services in other namespaces are reachable using their fully qualified DNS name (<service>.<namespace>.svc.cluster.local):
wget -qO- http://web-app-svc.staging.svc.cluster.local
This request succeeds, demonstrating that Kubernetes namespaces scope resource visibility and RBAC, but do not enforce network-level isolation on their own. To restrict cross-namespace traffic, NetworkPolicies must be used in addition to namespaces.
The same can be done to access the production web application:
wget -qO- http://web-app-svc.production.svc.cluster.local
5.2 Task 2: Design and deploy an internal API status endpoint in dev and QA namespaces
Your team needs to run the same internal API status endpoint in two isolated environments: dev and qa. Each environment must be fully self-contained, with its own Deployment and Service, so that developers and testers can work independently without interfering with each other.
The API status endpoint must run as a podinfo container, which returns JSON metadata including a configurable message that displays the namespace it is running in, making it easy to confirm namespace isolation programmatically. It does not need to be highly resilient, since brief periods of unavailability are acceptable.
Other services within each namespace need a stable address to reach the API status endpoint, but it must not be accessible from outside the cluster.
5.2.1 Architectural design
The task requires running the same application in two isolated environments, brief downtime is acceptable, and the application must be reachable only from inside each namespace. These constraints drive four design decisions:
-
Two separate Namespaces (
devandqa) provide the isolation boundary. Every Kubernetes resource is scoped to a Namespace, so Deployments, Pods, and Services created in one Namespace are invisible to the other. This lets both environments share the same resource names without conflict. -
Because the application is a single container and brief downtime is acceptable, a Deployment with one replica per Namespace is enough. Each Deployment creates its own ReplicaSet, which recreates the Pod automatically if it crashes, at the cost of a short period of unavailability that the task explicitly allows.
-
Other services within each Namespace need a stable address to reach the API status endpoint. Pod IPs change every time a Pod is recreated, so we place a ClusterIP Service (
api-status-svc) in front of the Pod in each Namespace. The Service provides a fixed cluster-internal DNS name and forwards traffic to the Pod. It accepts requests on port80and forwards them to the container’s port9898. -
The application must not be accessible from outside the cluster. A ClusterIP Service has no external port and no route from outside the cluster network, so it satisfies this requirement by design. No Gateway, Ingress, or NodePort is needed.
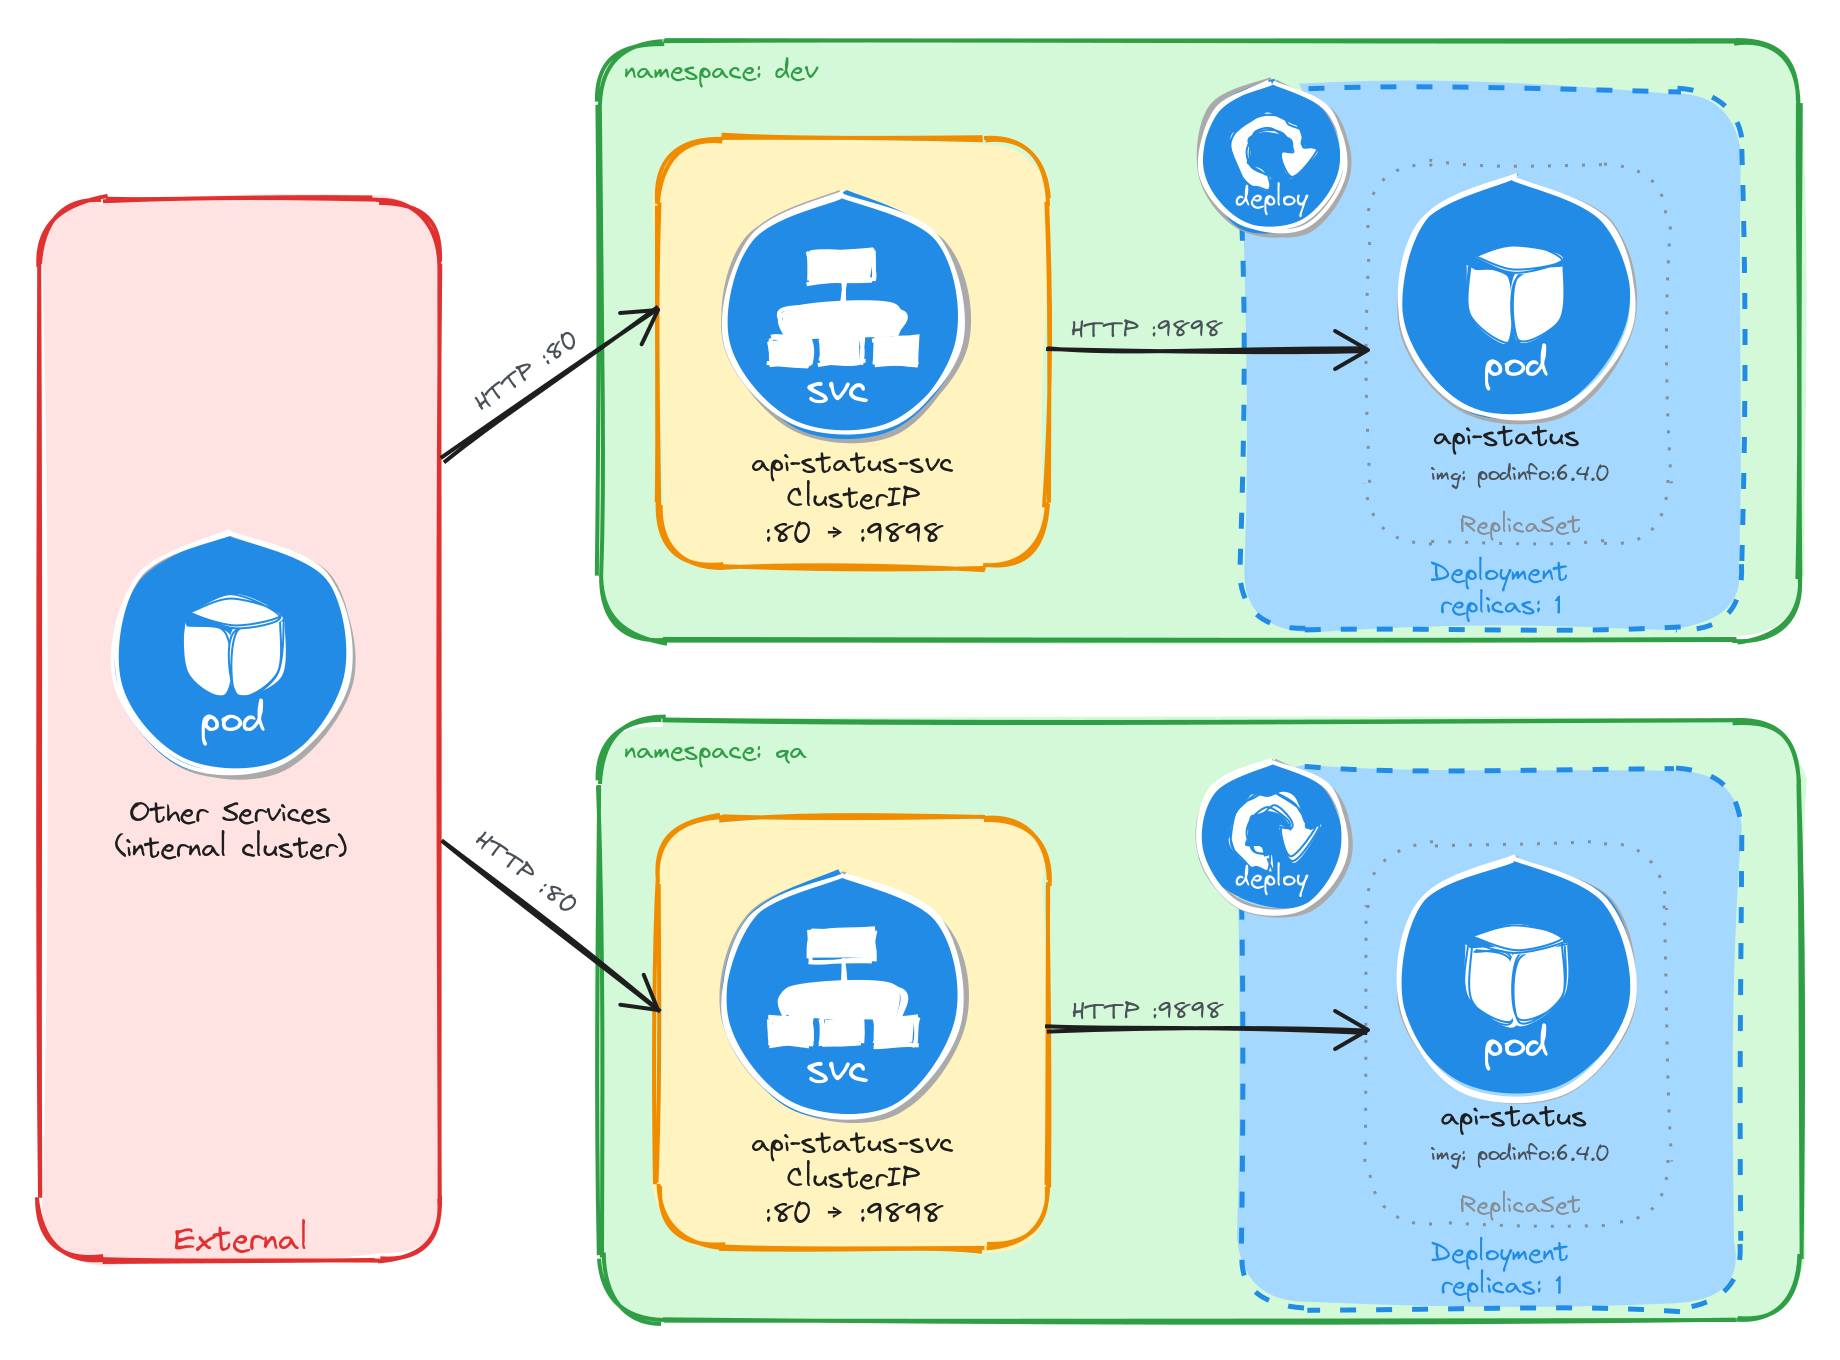
The diagram shows the resulting architecture: the dev and qa Namespaces each contain an independent Deployment and ClusterIP Service with the same names. External clients have no path into either environment, while internal services reach the API status endpoint through the ClusterIP Service in their own Namespace. Cross-namespace access is possible only via the fully qualified DNS name (api-status-svc.<namespace>.svc.cluster.local), since short Service names resolve only within the same Namespace.
5.2.2 Implementation
We start by creating the two namespaces:
kubectl create namespace dev
kubectl create namespace qa
Next, we create a file called api-status.yaml that will be reused for both environments:
cat <<EOF > api-status.yaml
With the following content:
apiVersion: apps/v1
kind: Deployment
metadata:
  name: api-status
  labels:
    app: api-status
spec:
  replicas: 1
  selector:
    matchLabels:
      app: api-status
  template:
    metadata:
      labels:
        app: api-status
    spec:
      containers:
        - name: podinfo
          image: stefanprodan/podinfo:6.4.0
          ports:
            - containerPort: 9898
          env:
            - name: PODINFO_UI_MESSAGE
              valueFrom:
                fieldRef:
                  fieldPath: metadata.namespace
EOF
The PODINFO_UI_MESSAGE environment variable is injected using the downward API, which allows a container to read its own Pod metadata at runtime. The podinfo application uses this variable to set the message field in its JSON response, making it easy to confirm which namespace the Pod is running in.
Notice that the manifest does not include a namespace field in the metadata. We will supply the target namespace at apply time using the -n flag, which lets us reuse the same manifest for both environments.
To verify the file was created correctly, run:
cat api-status.yaml
Apply the manifest to both namespaces:
kubectl apply -f api-status.yaml -n dev
kubectl apply -f api-status.yaml -n qa
Next, we expose each Deployment as a ClusterIP Service inside its respective namespace:
kubectl expose deployment api-status \
    -n dev \
    --name=api-status-svc \
    --type=ClusterIP \
    --port=80 \
    --target-port=9898
kubectl expose deployment api-status \
    -n qa \
    --name=api-status-svc \
    --type=ClusterIP \
    --port=80 \
    --target-port=9898
5.2.2.1 Verify resource creation
To verify that the Pods are running in each namespace, execute the following commands:
kubectl get pods -n dev -l app=api-status
kubectl get pods -n qa -l app=api-status
The output for each should look similar to this:
NAME                          READY   STATUS    RESTARTS   AGE
api-status-7d6c8b4f59-r3n8x   1/1     Running   0          1m
To verify that the Services are configured correctly in each namespace, run:
kubectl get svc -n dev api-status-svc
kubectl get svc -n qa api-status-svc
The output for each should look similar to this:
NAME              TYPE        CLUSTER-IP      EXTERNAL-IP   PORT(S)   AGE
api-status-svc    ClusterIP   10.96.185.42    <none>        80/TCP    1m
Note that the two Services share the same name (api-status-svc) but have different Cluster IPs, because they are independent resources in separate namespaces.
5.2.2.2 Test the API status endpoint
To test the dev API status endpoint, create a temporary Pod inside the dev namespace and send a request through the Service:
kubectl run -n dev -it --rm --restart=Never busybox --image=busybox -- sh
Inside the busybox Pod, use wget to access the API status endpoint through the Service:
wget -qO- http://api-status-svc
The response should be a JSON payload showing pod metadata, with the message field set to the namespace the Pod is running in:
{
  "hostname": "api-status-7d6c8b4f59-r3n8x",
  "version": "6.4.0",
  "revision": "",
  "color": "#34577c",
  "logo": "https://raw.githubusercontent.com/stefanprodan/podinfo/gh-pages/cuddle_clap.gif",
  "message": "dev",
  "goos": "linux",
  "goarch": "amd64",
  "runtime": "go1.21.0",
  "num_goroutine": "8",
  "num_cpu": "2"
}
To confirm that the response contains the correct namespace, run:
wget -qO- http://api-status-svc | grep '"message"'
The output should show the dev namespace:
"message": "dev",
Repeat the same test for the qa namespace by running the busybox Pod with -n qa. The message field should show qa instead of dev, confirming that each Deployment is running in its own isolated namespace.
5.2.2.3 Verify namespace isolation
To confirm that the short Service name does not resolve across namespaces, create a temporary Pod in the default namespace:
kubectl run -it --rm --restart=Never busybox --image=busybox -- sh
Inside this Pod, attempt to reach the dev API status endpoint using its short service name:
wget -qO- --timeout=5 http://api-status-svc
This fails because short Service names only resolve within the same namespace. Services in other namespaces are reachable using their fully qualified DNS name (<service>.<namespace>.svc.cluster.local):
wget -qO- http://api-status-svc.dev.svc.cluster.local
This request succeeds, demonstrating that Kubernetes namespaces scope resource visibility and RBAC, but do not enforce network-level isolation on their own. To restrict cross-namespace traffic, NetworkPolicies must be used in addition to namespaces.
The same can be done to access the QA API status endpoint:
wget -qO- http://api-status-svc.qa.svc.cluster.local
5.3 Task 3: Design and deploy an internal request debugging tool in team-isolated namespaces
Your organization has two independent development teams, team-alpha and team-beta, that share the same cluster. Each team needs its own instance of an internal request debugging tool so they can inspect HTTP headers and connection details without interfering with each other.
The debugging tool must run as a traefik/whoami container, which returns a plain-text summary of each incoming request including the server name, hostname, IP address, and headers. The server name will be set to the namespace through the downward API, making it easy to confirm namespace isolation from the response. It does not need to be highly resilient, since brief periods of unavailability are acceptable.
Other services within each namespace need a stable address to reach the debugging tool, but it must not be accessible from outside the cluster.
5.3.1 Architectural design
The task requires running the same application in two isolated environments, brief downtime is acceptable, and the application must be reachable only from inside each namespace. These constraints drive four design decisions:
-
Two separate Namespaces (
team-alphaandteam-beta) provide the isolation boundary. Every Kubernetes resource is scoped to a Namespace, so Deployments, Pods, and Services created in one Namespace are invisible to the other. This lets both environments share the same resource names without conflict. -
Because the application is a single container and brief downtime is acceptable, a Deployment with one replica per Namespace is enough. Each Deployment creates its own ReplicaSet, which recreates the Pod automatically if it crashes, at the cost of a short period of unavailability that the task explicitly allows.
-
Other services within each Namespace need a stable address to reach the debugging tool. Pod IPs change every time a Pod is recreated, so we place a ClusterIP Service (
request-debug-svc) in front of the Pod in each Namespace. The Service provides a fixed cluster-internal DNS name and forwards traffic to the Pod. It accepts requests on port80and forwards them to the container’s port80. -
The application must not be accessible from outside the cluster. A ClusterIP Service has no external port and no route from outside the cluster network, so it satisfies this requirement by design. No Gateway, Ingress, or NodePort is needed.
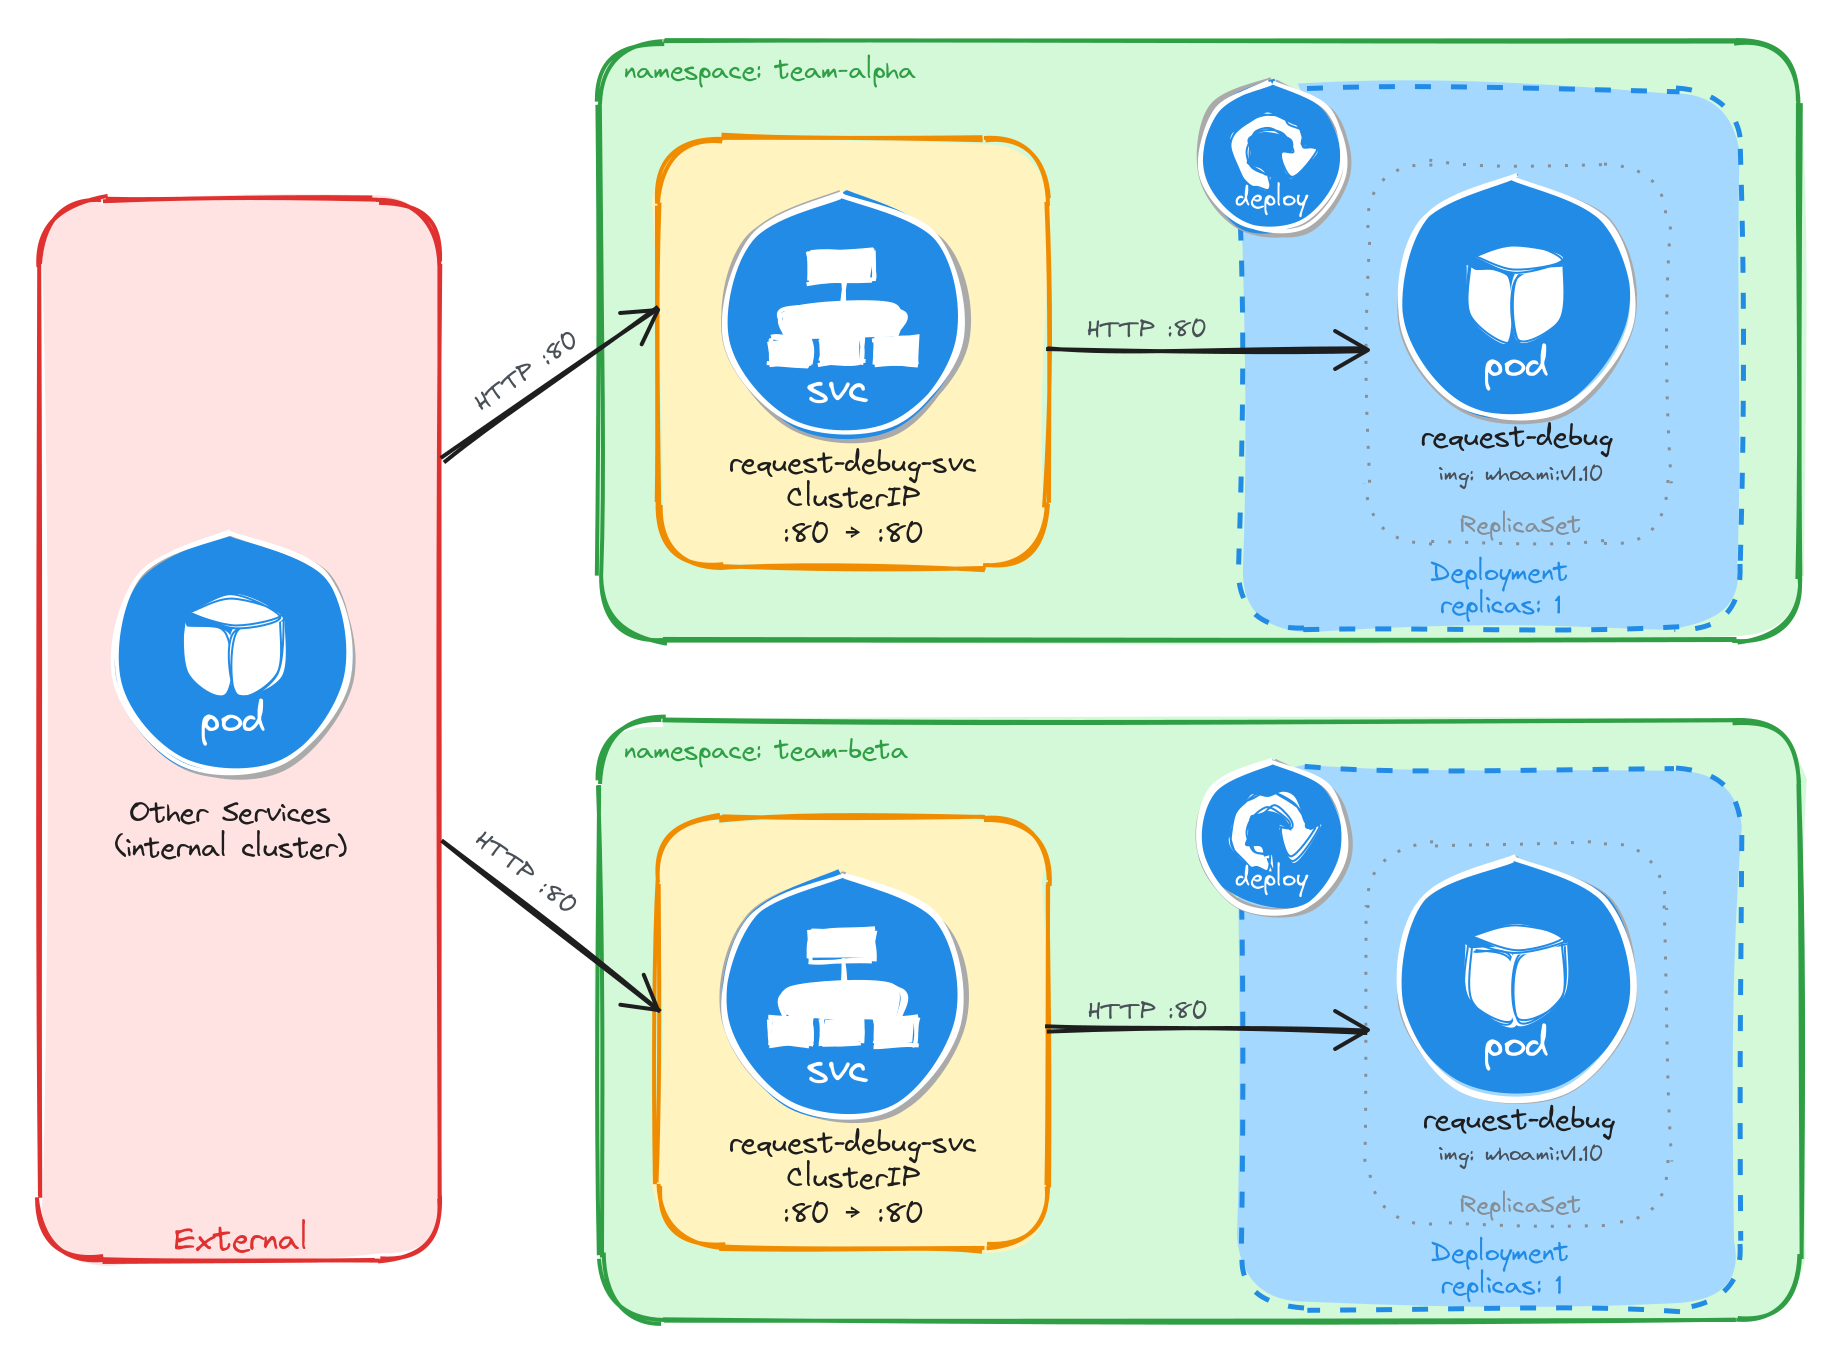
The diagram shows the resulting architecture: the team-alpha and team-beta Namespaces each contain an independent Deployment and ClusterIP Service with the same names. External clients have no path into either environment, while internal services reach the debugging tool through the ClusterIP Service in their own Namespace. Cross-namespace access is possible only via the fully qualified DNS name (request-debug-svc.<namespace>.svc.cluster.local), since short Service names resolve only within the same Namespace.
5.3.2 Implementation
We start by creating the two namespaces:
kubectl create namespace team-alpha
kubectl create namespace team-beta
Next, we create a file called request-debug.yaml that will be reused for both environments:
cat <<EOF > request-debug.yaml
With the following content:
apiVersion: apps/v1
kind: Deployment
metadata:
  name: request-debug
  labels:
    app: request-debug
spec:
  replicas: 1
  selector:
    matchLabels:
      app: request-debug
  template:
    metadata:
      labels:
        app: request-debug
    spec:
      containers:
        - name: whoami
          image: traefik/whoami:v1.10
          ports:
            - containerPort: 80
          env:
            - name: WHOAMI_NAME
              valueFrom:
                fieldRef:
                  fieldPath: metadata.namespace
EOF
The WHOAMI_NAME environment variable is injected using the downward API, which allows a container to read its own Pod metadata at runtime. The whoami application uses this variable to override the Name field in its plain-text response, making it easy to confirm which namespace the Pod is running in.
Notice that the manifest does not include a namespace field in the metadata. We will supply the target namespace at apply time using the -n flag, which lets us reuse the same manifest for both environments.
To verify the file was created correctly, run:
cat request-debug.yaml
Apply the manifest to both namespaces:
kubectl apply -f request-debug.yaml -n team-alpha
kubectl apply -f request-debug.yaml -n team-beta
Next, we expose each Deployment as a ClusterIP Service inside its respective namespace:
kubectl expose deployment request-debug \
    -n team-alpha \
    --name=request-debug-svc \
    --type=ClusterIP \
    --port=80 \
    --target-port=80
kubectl expose deployment request-debug \
    -n team-beta \
    --name=request-debug-svc \
    --type=ClusterIP \
    --port=80 \
    --target-port=80
5.3.2.1 Verify resource creation
To verify that the Pods are running in each namespace, execute the following commands:
kubectl get pods -n team-alpha -l app=request-debug
kubectl get pods -n team-beta -l app=request-debug
The output for each should look similar to this:
NAME                             READY   STATUS    RESTARTS   AGE
request-debug-5c8f9a7b64-k2v4p   1/1     Running   0          1m
To verify that the Services are configured correctly in each namespace, run:
kubectl get svc -n team-alpha request-debug-svc
kubectl get svc -n team-beta request-debug-svc
The output for each should look similar to this:
NAME                TYPE        CLUSTER-IP      EXTERNAL-IP   PORT(S)   AGE
request-debug-svc   ClusterIP   10.96.203.17    <none>        80/TCP    1m
Note that the two Services share the same name (request-debug-svc) but have different Cluster IPs, because they are independent resources in separate namespaces.
5.3.2.2 Test the request debugging tool
To test the team-alpha debugging tool, create a temporary Pod inside the team-alpha namespace and send a request through the Service:
kubectl run -n team-alpha -it --rm --restart=Never busybox --image=busybox -- sh
Inside the busybox Pod, use wget to access the debugging tool through the Service:
wget -qO- http://request-debug-svc
The response should be a plain-text summary showing request and server details, with the Name field set to the namespace the Pod is running in:
Name: team-alpha
Hostname: request-debug-5c8f9a7b64-k2v4p
IP: 127.0.0.1
IP: 10.244.0.12
RemoteAddr: 10.244.0.15:48762
GET / HTTP/1.1
Host: request-debug-svc
User-Agent: Wget
To confirm that the response contains the correct namespace, run:
wget -qO- http://request-debug-svc | grep 'Name:'
The output should show the team-alpha namespace:
Name: team-alpha
Repeat the same test for the team-beta namespace by running the busybox Pod with -n team-beta. The Name field should show team-beta instead of team-alpha, confirming that each Deployment is running in its own isolated namespace.
5.3.2.3 Verify namespace isolation
To confirm that the short Service name does not resolve across namespaces, create a temporary Pod in the default namespace:
kubectl run -it --rm --restart=Never busybox --image=busybox -- sh
Inside this Pod, attempt to reach the team-alpha debugging tool using its short service name:
wget -qO- --timeout=5 http://request-debug-svc
This fails because short Service names only resolve within the same namespace. Services in other namespaces are reachable using their fully qualified DNS name (<service>.<namespace>.svc.cluster.local):
wget -qO- http://request-debug-svc.team-alpha.svc.cluster.local
This request succeeds, demonstrating that Kubernetes namespaces scope resource visibility and RBAC, but do not enforce network-level isolation on their own. To restrict cross-namespace traffic, NetworkPolicies must be used in addition to namespaces.
The same can be done to access the team-beta debugging tool:
wget -qO- http://request-debug-svc.team-beta.svc.cluster.local
5.4 Task 4: Design and deploy a namespace verification endpoint in canary and stable namespaces
Your team uses a canary release strategy and needs a simple endpoint in each environment that confirms which namespace a request is being served from. This allows developers to verify that traffic is reaching the correct environment before promoting a canary release.
The endpoint must run as a hashicorp/http-echo container, which returns a configurable plain-text response. The response text will include the namespace name, injected at runtime through the downward API and Kubernetes variable substitution in the container arguments, making it easy to confirm namespace isolation from the response. It does not need to be highly resilient, since brief periods of unavailability are acceptable.
Other services within each namespace need a stable address to reach the endpoint, but it must not be accessible from outside the cluster.
5.4.1 Architectural design
The task requires running the same application in two isolated environments, brief downtime is acceptable, and the application must be reachable only from inside each namespace. These constraints drive four design decisions:
-
Two separate Namespaces (
canaryandstable) provide the isolation boundary. Every Kubernetes resource is scoped to a Namespace, so Deployments, Pods, and Services created in one Namespace are invisible to the other. This lets both environments share the same resource names without conflict. -
Because the application is a single container and brief downtime is acceptable, a Deployment with one replica per Namespace is enough. Each Deployment creates its own ReplicaSet, which recreates the Pod automatically if it crashes, at the cost of a short period of unavailability that the task explicitly allows.
-
Other services within each Namespace need a stable address to reach the namespace verification endpoint. Pod IPs change every time a Pod is recreated, so we place a ClusterIP Service (
ns-echo-svc) in front of the Pod in each Namespace. The Service provides a fixed cluster-internal DNS name and forwards traffic to the Pod. It accepts requests on port80and forwards them to the container’s port5678. -
The application must not be accessible from outside the cluster. A ClusterIP Service has no external port and no route from outside the cluster network, so it satisfies this requirement by design. No Gateway, Ingress, or NodePort is needed.

The diagram shows the resulting architecture: the canary and stable Namespaces each contain an independent Deployment and ClusterIP Service with the same names. External clients have no path into either environment, while internal services reach the namespace verification endpoint through the ClusterIP Service in their own Namespace. Cross-namespace access is possible only via the fully qualified DNS name (ns-echo-svc.<namespace>.svc.cluster.local), since short Service names resolve only within the same Namespace.
5.4.2 Implementation
We start by creating the two namespaces:
kubectl create namespace canary
kubectl create namespace stable
Next, we create a file called ns-echo.yaml that will be reused for both environments:
cat <<'EOF' > ns-echo.yaml
With the following content:
apiVersion: apps/v1
kind: Deployment
metadata:
  name: ns-echo
  labels:
    app: ns-echo
spec:
  replicas: 1
  selector:
    matchLabels:
      app: ns-echo
  template:
    metadata:
      labels:
        app: ns-echo
    spec:
      containers:
        - name: http-echo
          image: hashicorp/http-echo:0.2.3
          args:
            - "-text=namespace: $(ECHO_NAMESPACE)"
            - "-listen=:5678"
          ports:
            - containerPort: 5678
          env:
            - name: ECHO_NAMESPACE
              valueFrom:
                fieldRef:
                  fieldPath: metadata.namespace
EOF
The ECHO_NAMESPACE environment variable is injected using the downward API, which allows a container to read its own Pod metadata at runtime. Unlike the previous tasks, this container does not read the environment variable directly. Instead, the value is substituted into the container arguments using the $(ECHO_NAMESPACE) syntax. Kubernetes resolves this reference at Pod creation time, so the http-echo process receives -text=namespace: canary or -text=namespace: stable depending on which Namespace the Pod is scheduled in. The container then returns this text as the body of every HTTP response.
Notice that the manifest does not include a namespace field in the metadata. We will supply the target namespace at apply time using the -n flag, which lets us reuse the same manifest for both environments.
To verify the file was created correctly, run:
cat ns-echo.yaml
Apply the manifest to both namespaces:
kubectl apply -f ns-echo.yaml -n canary
kubectl apply -f ns-echo.yaml -n stable
Next, we expose each Deployment as a ClusterIP Service inside its respective namespace:
kubectl expose deployment ns-echo \
    -n canary \
    --name=ns-echo-svc \
    --type=ClusterIP \
    --port=80 \
    --target-port=5678
kubectl expose deployment ns-echo \
    -n stable \
    --name=ns-echo-svc \
    --type=ClusterIP \
    --port=80 \
    --target-port=5678
5.4.2.1 Verify resource creation
To verify that the Pods are running in each namespace, execute the following commands:
kubectl get pods -n canary -l app=ns-echo
kubectl get pods -n stable -l app=ns-echo
The output for each should look similar to this:
NAME                       READY   STATUS    RESTARTS   AGE
ns-echo-6b8d4f7c59-w3k9m   1/1     Running   0          1m
To verify that the Services are configured correctly in each namespace, run:
kubectl get svc -n canary ns-echo-svc
kubectl get svc -n stable ns-echo-svc
The output for each should look similar to this:
NAME           TYPE        CLUSTER-IP      EXTERNAL-IP   PORT(S)   AGE
ns-echo-svc    ClusterIP   10.96.147.93    <none>        80/TCP    1m
Note that the two Services share the same name (ns-echo-svc) but have different Cluster IPs, because they are independent resources in separate namespaces.
5.4.2.2 Test the namespace verification endpoint
To test the canary endpoint, create a temporary Pod inside the canary namespace and send a request through the Service:
kubectl run -n canary -it --rm --restart=Never busybox --image=busybox -- sh
Inside the busybox Pod, use wget to access the endpoint through the Service:
wget -qO- http://ns-echo-svc
The response should be plain text showing the namespace the Pod is running in:
namespace: canary
Repeat the same test for the stable namespace by running the busybox Pod with -n stable. The response should show namespace: stable instead of namespace: canary, confirming that each Deployment is running in its own isolated namespace.
5.4.2.3 Verify namespace isolation
To confirm that the short Service name does not resolve across namespaces, create a temporary Pod in the default namespace:
kubectl run -it --rm --restart=Never busybox --image=busybox -- sh
Inside this Pod, attempt to reach the canary endpoint using its short service name:
wget -qO- --timeout=5 http://ns-echo-svc
This fails because short Service names only resolve within the same namespace. Services in other namespaces are reachable using their fully qualified DNS name (<service>.<namespace>.svc.cluster.local):
wget -qO- http://ns-echo-svc.canary.svc.cluster.local
This request succeeds, demonstrating that Kubernetes namespaces scope resource visibility and RBAC, but do not enforce network-level isolation on their own. To restrict cross-namespace traffic, NetworkPolicies must be used in addition to namespaces.
The same can be done to access the stable endpoint:
wget -qO- http://ns-echo-svc.stable.svc.cluster.local
5.5 Task 5: Design and deploy an internal welcome page in blue-green namespaces
Your team uses a blue-green deployment strategy and needs an internal welcome page in each environment so that operators can verify which environment is currently active. Each environment must be fully self-contained, with its own Deployment and Service, so that one can be updated while the other continues to serve traffic undisturbed.
The welcome page must run as a nginxdemos/hello container using the plain-text tag, which returns a plain-text response showing server information such as the server address, server name, date, and request URI. Unlike the previous tasks, this container does not use the downward API to display the namespace, instead the server name corresponds to the Pod name, which is unique per namespace since each has its own independent Deployment and ReplicaSet. It does not need to be highly resilient, since brief periods of unavailability are acceptable.
Other services within each namespace need a stable address to reach the welcome page, but it must not be accessible from outside the cluster.
5.5.1 Architectural design
The task requires running the same application in two isolated environments, brief downtime is acceptable, and the application must be reachable only from inside each namespace. These constraints drive four design decisions:
-
Two separate Namespaces (
blueandgreen) provide the isolation boundary. Every Kubernetes resource is scoped to a Namespace, so Deployments, Pods, and Services created in one Namespace are invisible to the other. This lets both environments share the same resource names without conflict. -
Because the application is a single container and brief downtime is acceptable, a Deployment with one replica per Namespace is enough. Each Deployment creates its own ReplicaSet, which recreates the Pod automatically if it crashes, at the cost of a short period of unavailability that the task explicitly allows.
-
Other services within each Namespace need a stable address to reach the welcome page. Pod IPs change every time a Pod is recreated, so we place a ClusterIP Service (
ns-welcome-svc) in front of the Pod in each Namespace. The Service provides a fixed cluster-internal DNS name and forwards traffic to the Pod. It accepts requests on port8080and forwards them to the container’s port80. -
The application must not be accessible from outside the cluster. A ClusterIP Service has no external port and no route from outside the cluster network, so it satisfies this requirement by design. No Gateway, Ingress, or NodePort is needed.
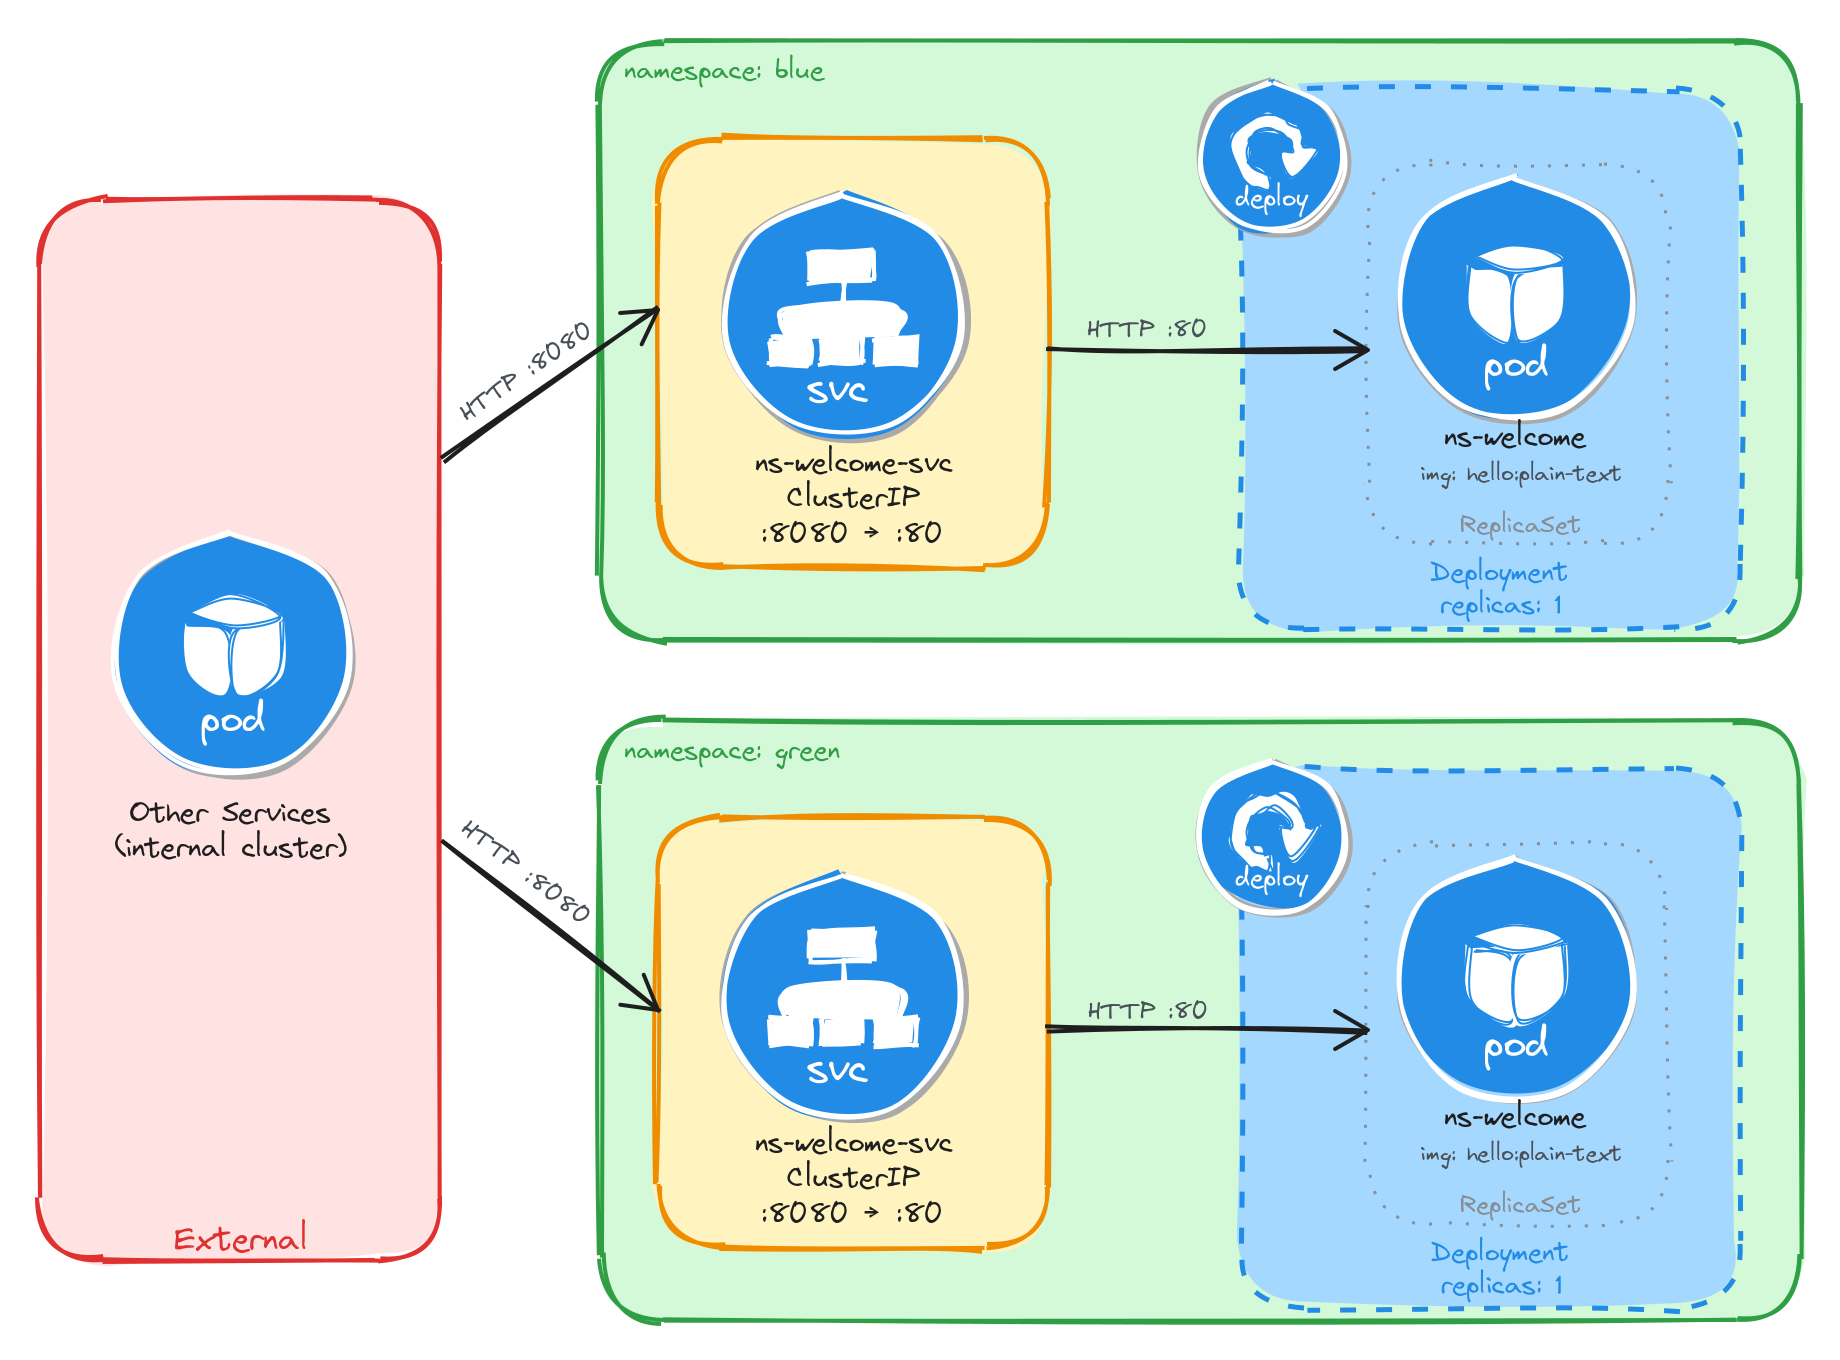
The diagram shows the resulting architecture: the blue and green Namespaces each contain an independent Deployment and ClusterIP Service with the same names. External clients have no path into either environment, while internal services reach the welcome page through the ClusterIP Service in their own Namespace. Cross-namespace access is possible only via the fully qualified DNS name (ns-welcome-svc.<namespace>.svc.cluster.local), since short Service names resolve only within the same Namespace.
5.5.2 Implementation
We start by creating the two namespaces:
kubectl create namespace blue
kubectl create namespace green
Next, we create a file called ns-welcome.yaml that will be reused for both environments:
cat <<EOF > ns-welcome.yaml
With the following content:
apiVersion: apps/v1
kind: Deployment
metadata:
  name: ns-welcome
  labels:
    app: ns-welcome
spec:
  replicas: 1
  selector:
    matchLabels:
      app: ns-welcome
  template:
    metadata:
      labels:
        app: ns-welcome
    spec:
      containers:
        - name: hello
          image: nginxdemos/hello:plain-text
          ports:
            - containerPort: 80
EOF
This manifest does not use the downward API because the nginxdemos/hello container does not support configuring its response through environment variables. The server name in the response is derived from the Pod name, which is generated by the ReplicaSet in each Namespace. Since each Namespace has its own Deployment and ReplicaSet, the Pod names will differ, making it possible to tell which environment served a request.
Notice that the manifest does not include a namespace field in the metadata. We will supply the target namespace at apply time using the -n flag, which lets us reuse the same manifest for both environments.
To verify the file was created correctly, run:
cat ns-welcome.yaml
Apply the manifest to both namespaces:
kubectl apply -f ns-welcome.yaml -n blue
kubectl apply -f ns-welcome.yaml -n green
Next, we expose each Deployment as a ClusterIP Service inside its respective namespace:
kubectl expose deployment ns-welcome \
    -n blue \
    --name=ns-welcome-svc \
    --type=ClusterIP \
    --port=8080 \
    --target-port=80
kubectl expose deployment ns-welcome \
    -n green \
    --name=ns-welcome-svc \
    --type=ClusterIP \
    --port=8080 \
    --target-port=80
5.5.2.1 Verify resource creation
To verify that the Pods are running in each namespace, execute the following commands:
kubectl get pods -n blue -l app=ns-welcome
kubectl get pods -n green -l app=ns-welcome
The output for each should look similar to this:
NAME                          READY   STATUS    RESTARTS   AGE
ns-welcome-6c9d4f8b5a-t4w2q   1/1     Running   0          1m
To verify that the Services are configured correctly in each namespace, run:
kubectl get svc -n blue ns-welcome-svc
kubectl get svc -n green ns-welcome-svc
The output for each should look similar to this:
NAME              TYPE        CLUSTER-IP      EXTERNAL-IP   PORT(S)    AGE
ns-welcome-svc    ClusterIP   10.96.118.56    <none>        8080/TCP   1m
Note that the two Services share the same name (ns-welcome-svc) but have different Cluster IPs, because they are independent resources in separate namespaces.
5.5.2.2 Test the welcome page
To test the blue welcome page, create a temporary Pod inside the blue namespace and send a request through the Service:
kubectl run -n blue -it --rm --restart=Never busybox --image=busybox -- sh
Inside the busybox Pod, use wget to access the welcome page through the Service:
wget -qO- http://ns-welcome-svc:8080
The response should be plain text showing server information:
Server address: 10.244.0.18:80
Server name: ns-welcome-6c9d4f8b5a-t4w2q
Date: 31/Mar/2026:14:22:05 +0000
URI: /
Request ID: e7a3b1c9d4f2e8a6b0c5d7f1a9e3b2c4
To identify which Pod served the request, run:
wget -qO- http://ns-welcome-svc:8080 | grep 'Server name:'
The output should show the Pod name from the blue namespace:
Server name: ns-welcome-6c9d4f8b5a-t4w2q
Repeat the same test for the green namespace by running the busybox Pod with -n green. The server name should show a different Pod name, confirming that each Namespace has its own independent Deployment with separately managed Pods.
5.5.2.3 Verify namespace isolation
To confirm that the short Service name does not resolve across namespaces, create a temporary Pod in the default namespace:
kubectl run -it --rm --restart=Never busybox --image=busybox -- sh
Inside this Pod, attempt to reach the blue welcome page using its short service name:
wget -qO- --timeout=5 http://ns-welcome-svc:8080
This fails because short Service names only resolve within the same namespace. Services in other namespaces are reachable using their fully qualified DNS name (<service>.<namespace>.svc.cluster.local):
wget -qO- http://ns-welcome-svc.blue.svc.cluster.local:8080
This request succeeds, demonstrating that Kubernetes namespaces scope resource visibility and RBAC, but do not enforce network-level isolation on their own. To restrict cross-namespace traffic, NetworkPolicies must be used in addition to namespaces.
The same can be done to access the green welcome page:
wget -qO- http://ns-welcome-svc.green.svc.cluster.local:8080
6 Resilient application deployment
Design and deploy an application and configure it to run with multiple replicas across the cluster.
This category includes the following learning objectives:
- Understanding of Pods.
- Understanding of Deployments.
- Understanding of ReplicaSets.
6.1 Task 1: Design and deploy a resilient web server with multiple replicas
Your team needs an internal web server that must remain available even when individual Pod instances fail or are rescheduled. The service must continue serving requests without manual intervention.
The web server must run as an nginx container with three replicas to ensure availability across failures. Other services inside the cluster need a stable address to reach it, but it must not be accessible from outside the cluster.
6.1.1 Architectural design
The task requires an internal web server that stays available across Pod failures without manual intervention, and must be reachable only from inside the cluster. These constraints drive three design decisions:
-
A Deployment with three replicas ensures the web server remains available even when individual Pods fail or are rescheduled. The Deployment creates a ReplicaSet that continuously reconciles the actual number of running Pods with the desired count. If a Pod crashes or is evicted, the ReplicaSet controller detects the mismatch and immediately schedules a replacement, restoring full capacity without manual intervention.
-
Other services need a stable address to reach the web server. Pod IPs change every time a Pod is recreated, and with three replicas there are three different IPs at any given moment. A ClusterIP Service (
nginx-resilient-svc) solves both problems: it provides a fixed cluster-internal DNS name and load-balances traffic across all healthy replicas, so callers are unaffected by individual Pod restarts or rescheduling. -
The web server must not be accessible from outside the cluster. A ClusterIP Service has no external port and no route from outside the cluster network, so it satisfies this requirement by design. No Gateway, Ingress, or NodePort is needed.
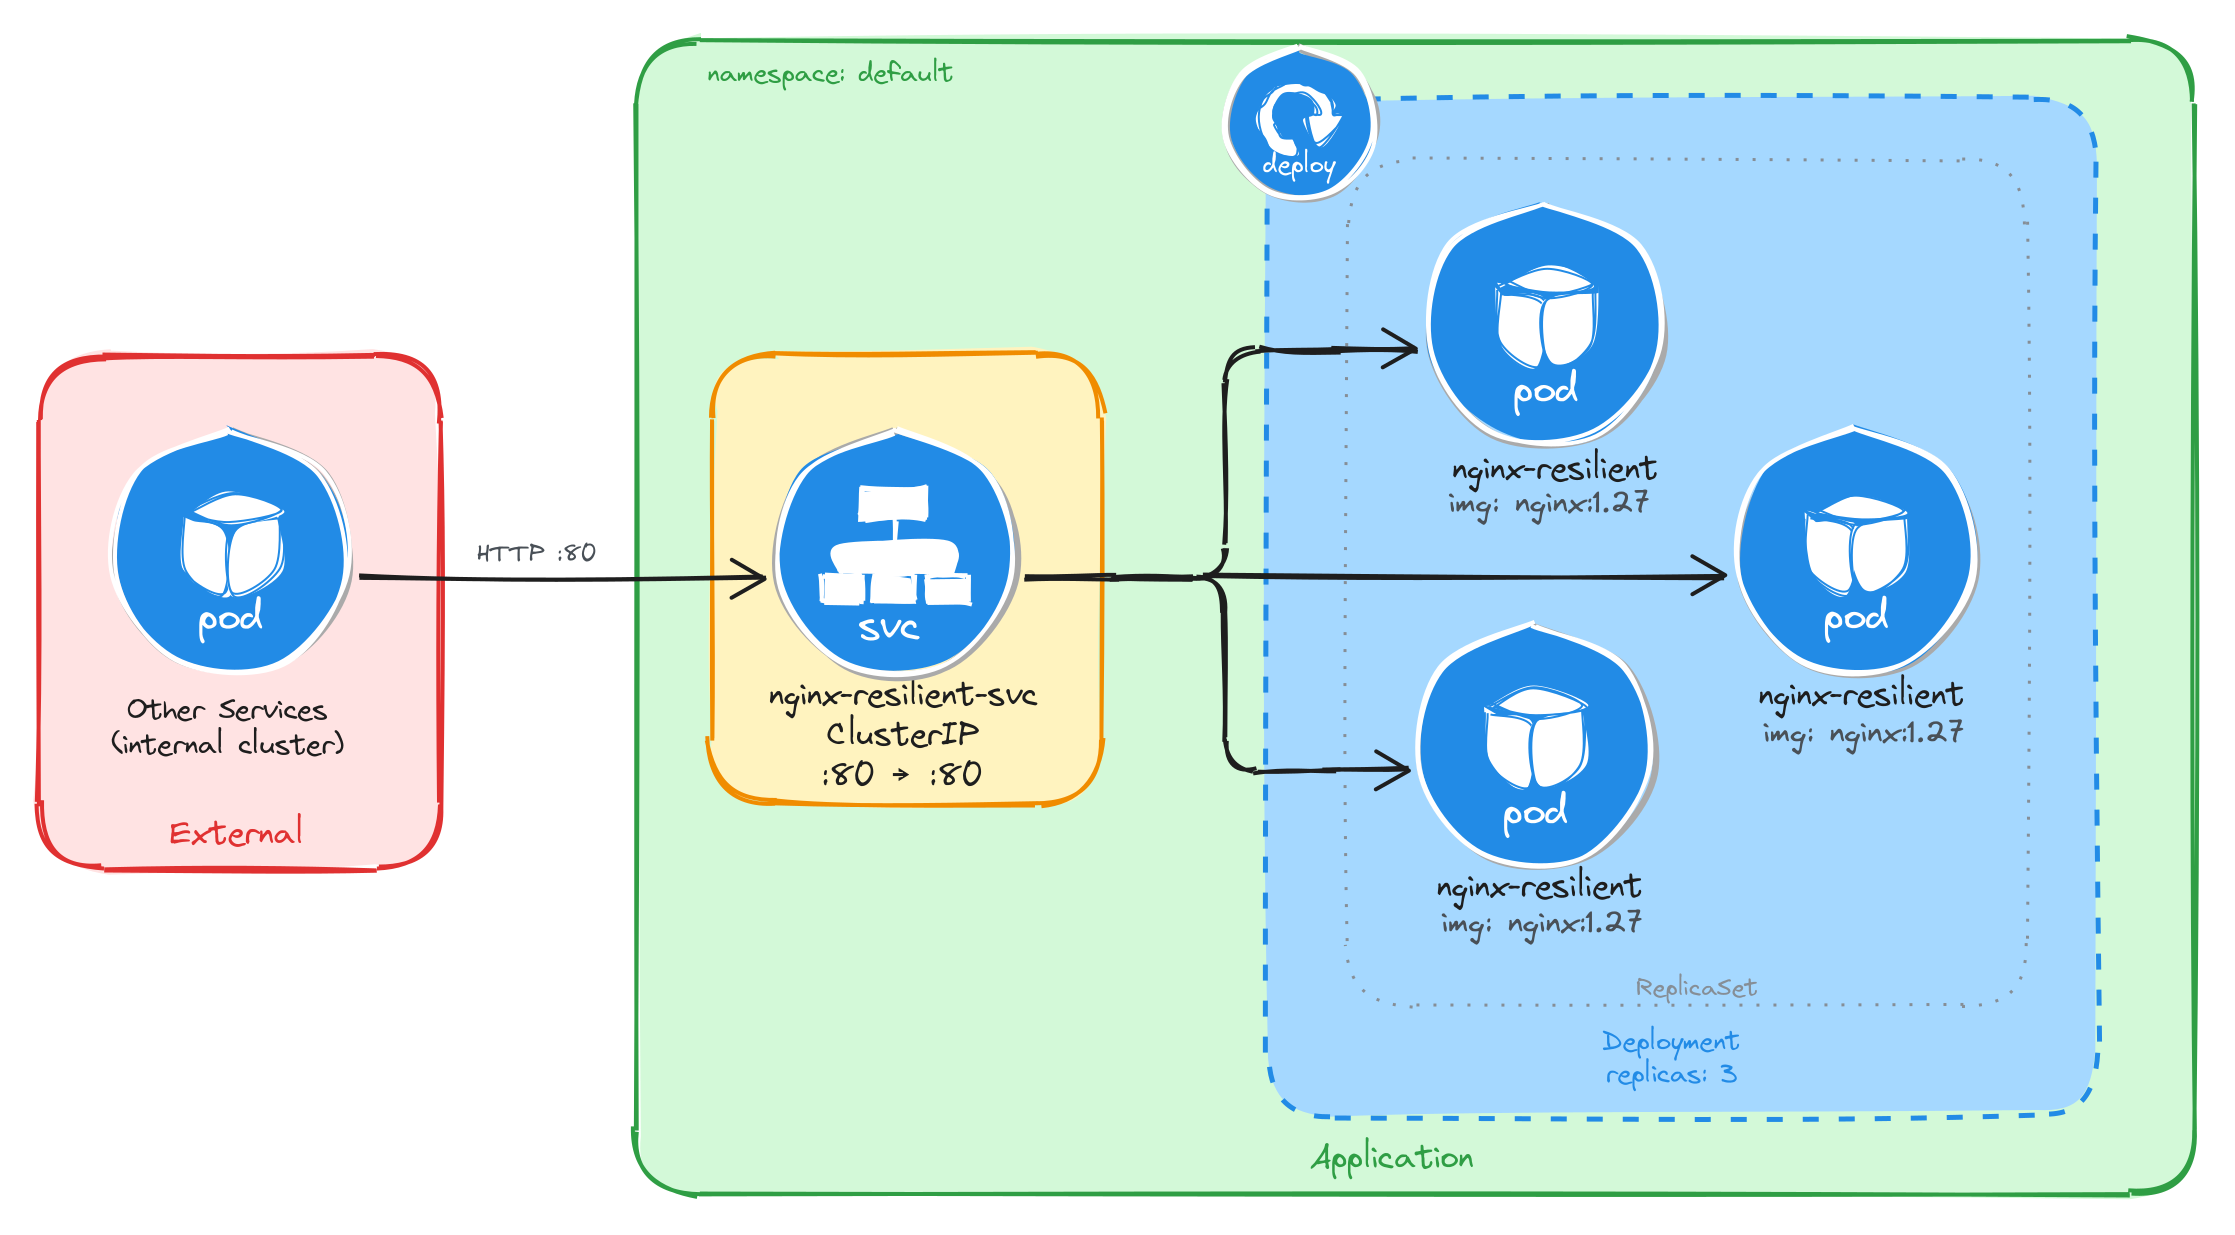
The diagram shows the resulting architecture: external clients have no path into the application, while internal services reach the web server through the ClusterIP Service, which load-balances traffic across the three Pod replicas managed by the Deployment’s ReplicaSet.
6.1.2 Implementation
We start by creating a Deployment with three replicas. The --replicas=3 flag tells the Deployment controller to keep three Pod instances running at all times. If a Pod crashes or is deleted, the controller will automatically create a replacement to restore the desired count.
kubectl create deployment nginx-resilient \
    --image=nginx:1.27 \
    --port=80 \
    --replicas=3
To inspect the YAML that would be applied without actually creating the resource, use the --dry-run=client -o yaml flags:
kubectl create deployment nginx-resilient \
    --image=nginx:1.27 \
    --port=80 \
    --replicas=3 \
    --dry-run=client -o yaml
The output should look similar to this:
apiVersion: apps/v1
kind: Deployment
metadata:
  creationTimestamp: null
  labels:
    app: nginx-resilient
  name: nginx-resilient
spec:
  replicas: 3
  selector:
    matchLabels:
      app: nginx-resilient
  strategy: {}
  template:
    metadata:
      creationTimestamp: null
      labels:
        app: nginx-resilient
    spec:
      containers:
      - image: nginx:1.27
        name: nginx
        ports:
        - containerPort: 80
        resources: {}
status: {}
Next, we expose the Deployment as a ClusterIP Service. The Service gives other cluster workloads a single stable address that load-balances across all three Pod replicas, so callers are unaffected by individual Pod restarts or rescheduling.
kubectl expose deployment nginx-resilient \
    --name=nginx-resilient-svc \
    --type=ClusterIP \
    --port=80 \
    --target-port=80
6.1.2.1 Verify resource creation
To verify that all three Pods are running, execute:
kubectl get pods -l app=nginx-resilient
The output should show three Pods in the Running state:
NAME                                READY   STATUS    RESTARTS   AGE
nginx-resilient-7d6b8f9c4d-4k2pq    1/1     Running   0          1m
nginx-resilient-7d6b8f9c4d-r9fxz    1/1     Running   0          1m
nginx-resilient-7d6b8f9c4d-tn8wl    1/1     Running   0          1m
To verify that the Service is configured correctly, run:
kubectl get svc nginx-resilient-svc
The output should look similar to this:
NAME                  TYPE        CLUSTER-IP     EXTERNAL-IP   PORT(S)   AGE
nginx-resilient-svc   ClusterIP   10.96.204.17   <none>        80/TCP    1m
6.1.2.2 Understand the Deployment, ReplicaSet, and Pod relationship
When a Deployment is created, Kubernetes automatically creates a ReplicaSet to manage the Pod instances. The Deployment owns the ReplicaSet, and the ReplicaSet owns the Pods. This three-level hierarchy is what makes self-healing possible: the ReplicaSet controller continuously reconciles the actual number of running Pods with the desired replica count specified in the Deployment.
To inspect the ReplicaSet that the Deployment created, run:
kubectl get replicasets -l app=nginx-resilient
The output should look similar to this:
NAME                          DESIRED   CURRENT   READY   AGE
nginx-resilient-7d6b8f9c4d    3         3         3       2m
The DESIRED, CURRENT, and READY columns all showing 3 confirms that the ReplicaSet has successfully started three Pod instances and all three are ready to serve traffic.
To inspect the full ownership chain from the Deployment down to a single Pod, run:
kubectl describe pod \
    $(kubectl get pods -l app=nginx-resilient \
        -o jsonpath='{.items[0].metadata.name}') \
    | grep 'Controlled By'
The output shows that the Pod is controlled by the ReplicaSet:
Controlled By: ReplicaSet/nginx-resilient-7d6b8f9c4d
6.1.2.3 Verify self-healing behavior
To verify that the Deployment automatically replaces failed Pods, delete one of the running Pods:
POD_NAME=$(kubectl get pods \
    -l app=nginx-resilient \
    -o jsonpath='{.items[0].metadata.name}') \
&& echo $POD_NAME
kubectl delete pod $POD_NAME
To observe the replacement in real time, open a second terminal and watch the Pods:
kubectl get pods -l app=nginx-resilient --watch
Then delete the Pod in the first terminal. The watch output will show the deleted Pod terminating while a new one is already being created to replace it:
NAME                                READY   STATUS              RESTARTS   AGE
nginx-resilient-7d6b8f9c4d-4k2pq    0/1     Terminating         0          5m
nginx-resilient-7d6b8f9c4d-r9fxz    1/1     Running             0          5m
nginx-resilient-7d6b8f9c4d-tn8wl    1/1     Running             0          5m
nginx-resilient-7d6b8f9c4d-x7bmc    0/1     ContainerCreating   0          2s
Within a few seconds, all three Pods will be running again:
NAME                                READY   STATUS    RESTARTS   AGE
nginx-resilient-7d6b8f9c4d-r9fxz    1/1     Running   0          6m
nginx-resilient-7d6b8f9c4d-tn8wl    1/1     Running   0          6m
nginx-resilient-7d6b8f9c4d-x7bmc    1/1     Running   0          30s
This behavior is driven by the ReplicaSet controller detecting that the actual Pod count (two) is less than the desired count (three) and immediately scheduling a replacement.
6.1.2.4 Test the web server
To test that the Service correctly load-balances across the replicas, create a temporary Pod and send a request through the Service:
kubectl run -it --rm --restart=Never busybox --image=busybox sh
Inside the busybox Pod, use wget to send several requests through the Service:
for i in $(seq 1 9); do
    wget -qO- http://nginx-resilient-svc > /dev/null \
        && echo "request $i done"
done
Exit the busybox Pod, then check the access logs of each nginx replica:
for pod in $(kubectl get pods -l app=nginx-resilient -o name); do
    echo "=== $pod ==="
    kubectl logs $pod | grep "GET /"
done
The output shows each Pod’s access log with only the requests it handled, confirming that the Service distributed traffic across all three replicas:
=== pod/nginx-resilient-7d6b8f9c4d-r9fxz ===
10.244.0.12 - - [05/Mar/2026:10:30:00 +0000] "GET / HTTP/1.1" 200 615 "-" "Wget"
10.244.0.12 - - [05/Mar/2026:10:30:01 +0000] "GET / HTTP/1.1" 200 615 "-" "Wget"
10.244.0.12 - - [05/Mar/2026:10:30:02 +0000] "GET / HTTP/1.1" 200 615 "-" "Wget"
=== pod/nginx-resilient-7d6b8f9c4d-tn8wl ===
10.244.0.12 - - [05/Mar/2026:10:30:01 +0000] "GET / HTTP/1.1" 200 615 "-" "Wget"
10.244.0.12 - - [05/Mar/2026:10:30:03 +0000] "GET / HTTP/1.1" 200 615 "-" "Wget"
10.244.0.12 - - [05/Mar/2026:10:30:04 +0000] "GET / HTTP/1.1" 200 615 "-" "Wget"
=== pod/nginx-resilient-7d6b8f9c4d-x7bmc ===
10.244.0.12 - - [05/Mar/2026:10:30:02 +0000] "GET / HTTP/1.1" 200 615 "-" "Wget"
10.244.0.12 - - [05/Mar/2026:10:30:03 +0000] "GET / HTTP/1.1" 200 615 "-" "Wget"
10.244.0.12 - - [05/Mar/2026:10:30:05 +0000] "GET / HTTP/1.1" 200 615 "-" "Wget"
The Service acts as a stable endpoint regardless of how many Pods are running at any given moment, which means callers never need to track individual Pod IPs.
6.2 Task 2: Design and deploy a resilient API service with multiple replicas
Your team needs an internal API service that returns runtime metadata about the application. It must remain available even when individual Pod instances fail or are rescheduled, and the service must continue responding to requests without manual intervention.
The API service must run as a podinfo container with four replicas to ensure high availability across failures. Other services inside the cluster need a stable address to reach it, but it must not be accessible from outside the cluster.
6.2.1 Architectural design
The task requires an internal API service that stays available across Pod failures without manual intervention, and must be reachable only from inside the cluster. These constraints drive three design decisions:
-
A Deployment with four replicas ensures the API service remains available even when individual Pods fail or are rescheduled. The Deployment creates a ReplicaSet that continuously reconciles the actual number of running Pods with the desired count. If a Pod crashes or is evicted, the ReplicaSet controller detects the mismatch and immediately schedules a replacement, restoring full capacity without manual intervention.
-
Other services need a stable address to reach the API service. Pod IPs change every time a Pod is recreated, and with four replicas there are four different IPs at any given moment. A ClusterIP Service (
podinfo-resilient-svc) solves both problems: it provides a fixed cluster-internal DNS name and load-balances traffic across all healthy replicas, so callers are unaffected by individual Pod restarts or rescheduling. -
The API service must not be accessible from outside the cluster. A ClusterIP Service has no external port and no route from outside the cluster network, so it satisfies this requirement by design. No Gateway, Ingress, or NodePort is needed.
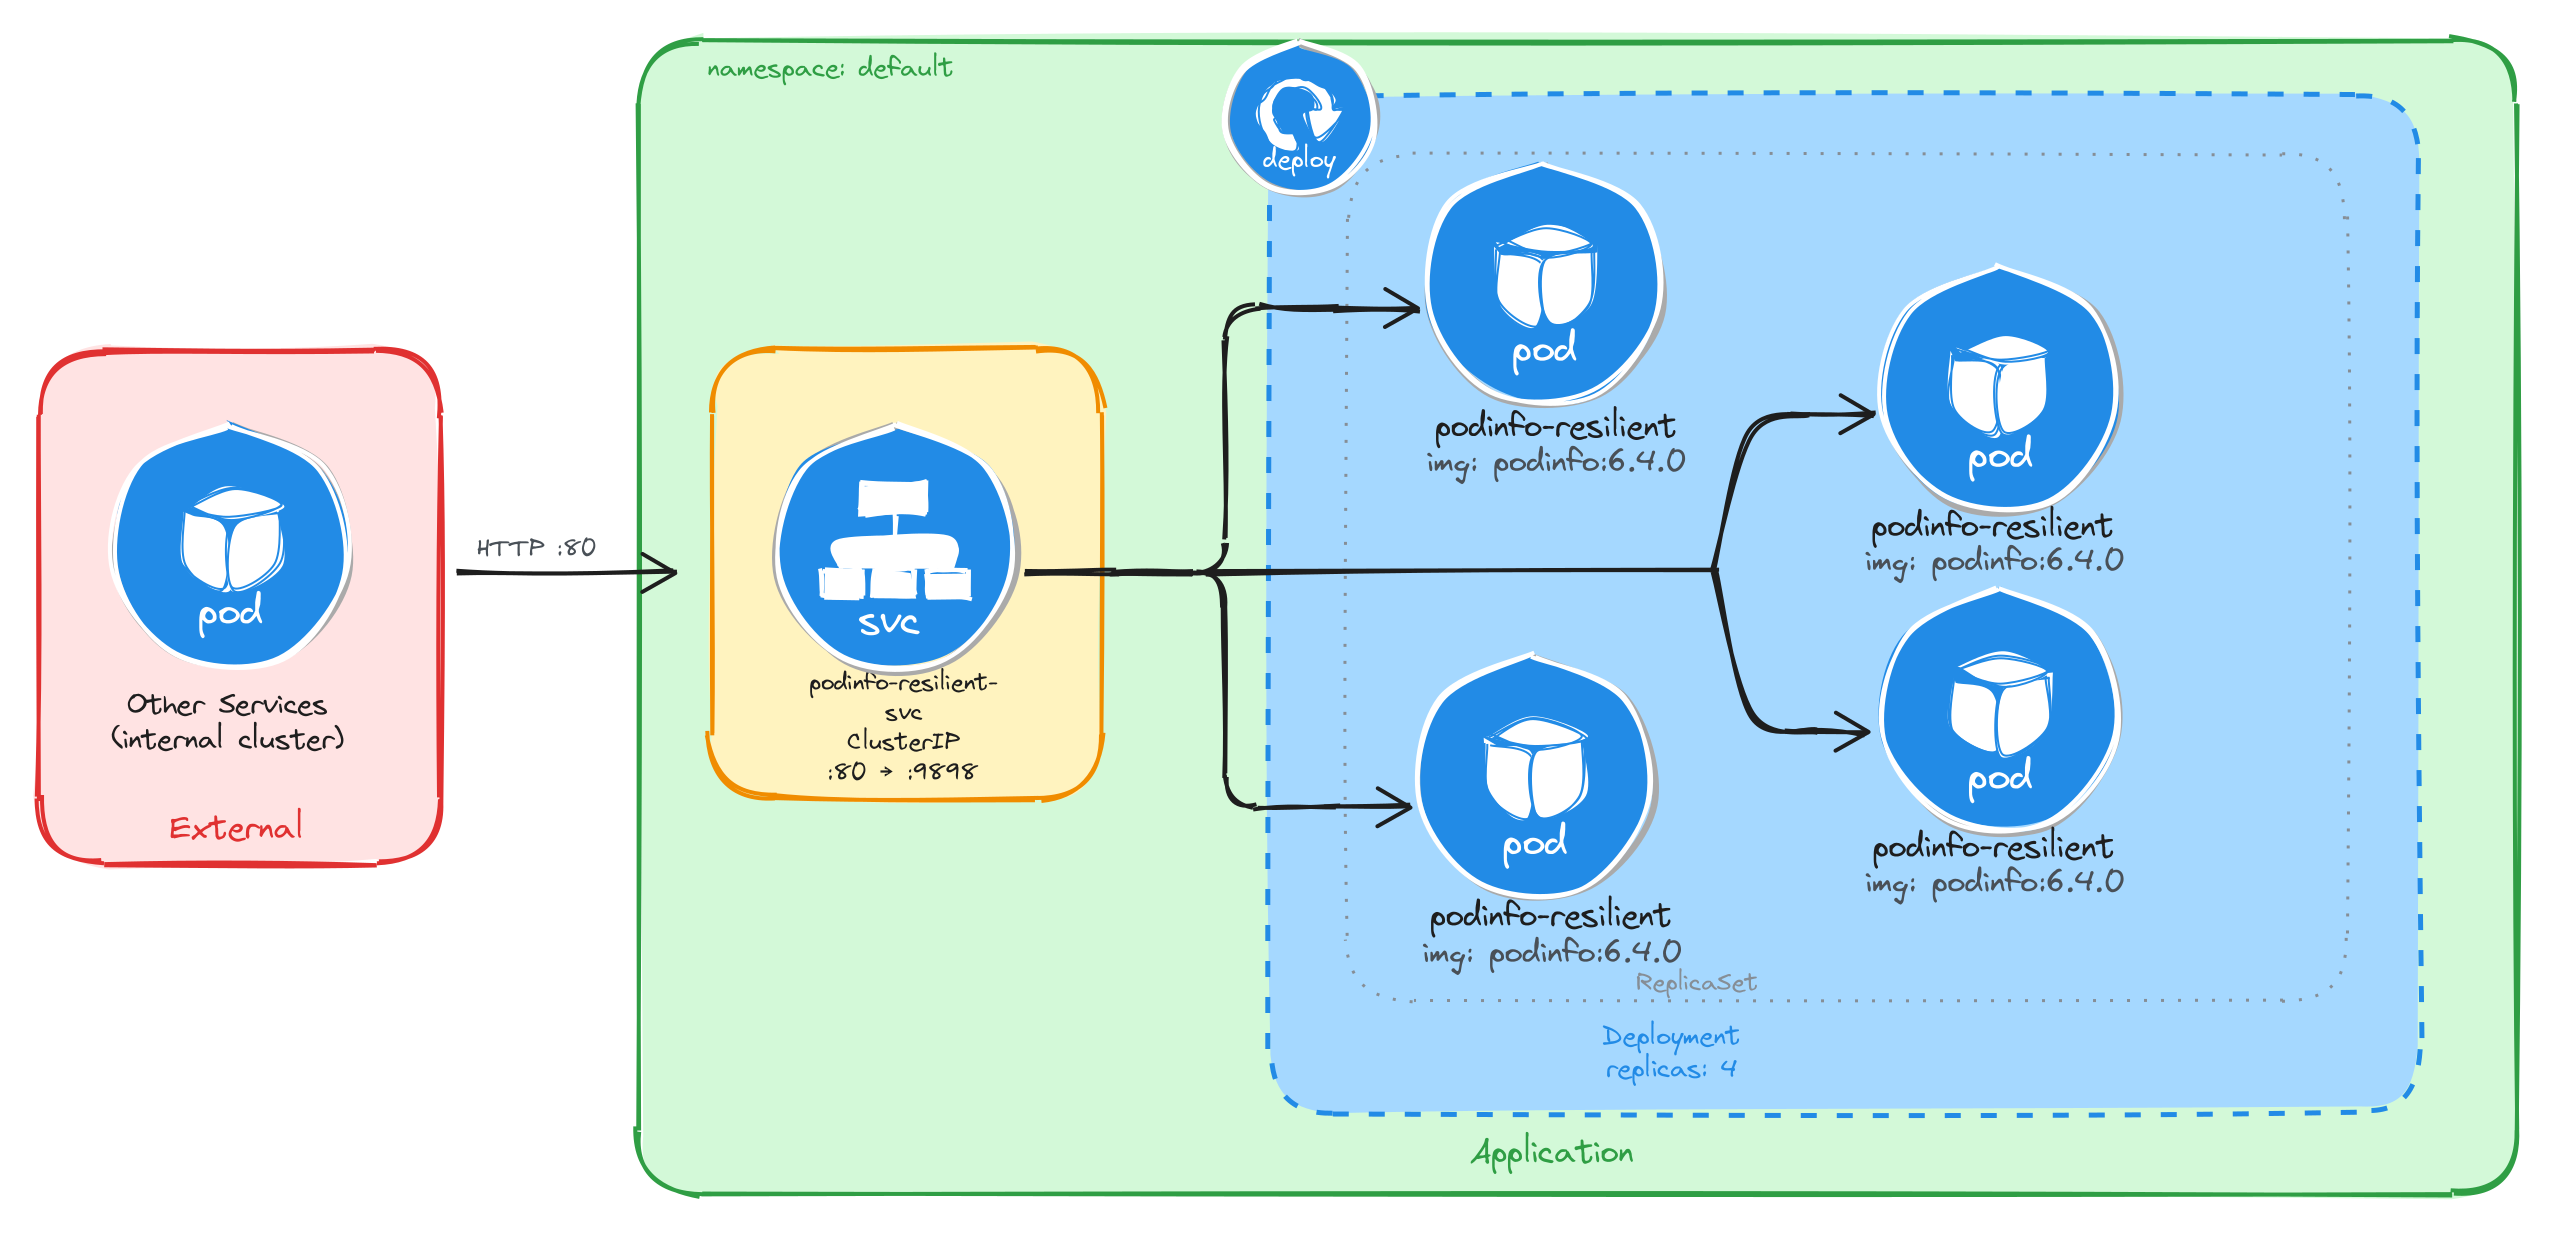
The diagram shows the resulting architecture: external clients have no path into the application, while internal services reach the API service through the ClusterIP Service, which load-balances traffic across the four Pod replicas managed by the Deployment’s ReplicaSet.
6.2.2 Implementation
We start by creating a Deployment with four replicas. The --replicas=4 flag tells the Deployment controller to keep four Pod instances running at all times. If a Pod crashes or is deleted, the controller will automatically create a replacement to restore the desired count.
kubectl create deployment podinfo-resilient \
    --image=stefanprodan/podinfo:6.4.0 \
    --port=9898 \
    --replicas=4
To inspect the YAML that would be applied without actually creating the resource, use the --dry-run=client -o yaml flags:
kubectl create deployment podinfo-resilient \
    --image=stefanprodan/podinfo:6.4.0 \
    --port=9898 \
    --replicas=4 \
    --dry-run=client -o yaml
The output should look similar to this:
apiVersion: apps/v1
kind: Deployment
metadata:
  creationTimestamp: null
  labels:
    app: podinfo-resilient
  name: podinfo-resilient
spec:
  replicas: 4
  selector:
    matchLabels:
      app: podinfo-resilient
  strategy: {}
  template:
    metadata:
      creationTimestamp: null
      labels:
        app: podinfo-resilient
    spec:
      containers:
      - image: stefanprodan/podinfo:6.4.0
        name: podinfo
        ports:
        - containerPort: 9898
        resources: {}
status: {}
Next, we expose the Deployment as a ClusterIP Service. The Service gives other cluster workloads a single stable address that load-balances across all four Pod replicas, so callers are unaffected by individual Pod restarts or rescheduling.
kubectl expose deployment podinfo-resilient \
    --name=podinfo-resilient-svc \
    --type=ClusterIP \
    --port=80 \
    --target-port=9898
6.2.2.1 Verify resource creation
To verify that all four Pods are running, execute:
kubectl get pods -l app=podinfo-resilient
The output should show four Pods in the Running state:
NAME                                  READY   STATUS    RESTARTS   AGE
podinfo-resilient-5b8c7d9f64-2k8np    1/1     Running   0          1m
podinfo-resilient-5b8c7d9f64-7r3qw    1/1     Running   0          1m
podinfo-resilient-5b8c7d9f64-d4x9m    1/1     Running   0          1m
podinfo-resilient-5b8c7d9f64-p6v2t    1/1     Running   0          1m
To verify that the Service is configured correctly, run:
kubectl get svc podinfo-resilient-svc
The output should look similar to this:
NAME                    TYPE        CLUSTER-IP     EXTERNAL-IP   PORT(S)   AGE
podinfo-resilient-svc   ClusterIP   10.96.178.35   <none>        80/TCP    1m
6.2.2.2 Understand the Deployment, ReplicaSet, and Pod relationship
When a Deployment is created, Kubernetes automatically creates a ReplicaSet to manage the Pod instances. The Deployment owns the ReplicaSet, and the ReplicaSet owns the Pods. This three-level hierarchy is what makes self-healing possible: the ReplicaSet controller continuously reconciles the actual number of running Pods with the desired replica count specified in the Deployment.
To inspect the ReplicaSet that the Deployment created, run:
kubectl get replicasets -l app=podinfo-resilient
The output should look similar to this:
NAME                            DESIRED   CURRENT   READY   AGE
podinfo-resilient-5b8c7d9f64    4         4         4       2m
The DESIRED, CURRENT, and READY columns all showing 4 confirms that the ReplicaSet has successfully started four Pod instances and all four are ready to serve traffic.
To inspect the full ownership chain from the Deployment down to a single Pod, run:
kubectl describe pod \
    $(kubectl get pods -l app=podinfo-resilient \
        -o jsonpath='{.items[0].metadata.name}') \
    | grep 'Controlled By'
The output shows that the Pod is controlled by the ReplicaSet:
Controlled By: ReplicaSet/podinfo-resilient-5b8c7d9f64
6.2.2.3 Verify self-healing behavior
To verify that the Deployment automatically replaces failed Pods, delete one of the running Pods:
POD_NAME=$(kubectl get pods \
    -l app=podinfo-resilient \
    -o jsonpath='{.items[0].metadata.name}') \
&& echo $POD_NAME
kubectl delete pod $POD_NAME
To observe the replacement in real time, open a second terminal and watch the Pods:
kubectl get pods -l app=podinfo-resilient --watch
Then delete the Pod in the first terminal. The watch output will show the deleted Pod terminating while a new one is already being created to replace it:
NAME                                  READY   STATUS              RESTARTS   AGE
podinfo-resilient-5b8c7d9f64-2k8np    0/1     Terminating         0          5m
podinfo-resilient-5b8c7d9f64-7r3qw    1/1     Running             0          5m
podinfo-resilient-5b8c7d9f64-d4x9m    1/1     Running             0          5m
podinfo-resilient-5b8c7d9f64-p6v2t    1/1     Running             0          5m
podinfo-resilient-5b8c7d9f64-h9c3f    0/1     ContainerCreating   0          2s
Within a few seconds, all four Pods will be running again:
NAME                                  READY   STATUS    RESTARTS   AGE
podinfo-resilient-5b8c7d9f64-7r3qw    1/1     Running   0          6m
podinfo-resilient-5b8c7d9f64-d4x9m    1/1     Running   0          6m
podinfo-resilient-5b8c7d9f64-p6v2t    1/1     Running   0          6m
podinfo-resilient-5b8c7d9f64-h9c3f    1/1     Running   0          30s
This behavior is driven by the ReplicaSet controller detecting that the actual Pod count (three) is less than the desired count (four) and immediately scheduling a replacement.
6.2.2.4 Test the API service
To test that the Service correctly load-balances across the replicas, create a temporary Pod and send a request through the Service:
kubectl run -it --rm --restart=Never busybox --image=busybox sh
Inside the busybox Pod, use wget to send several requests through the Service and observe which Pod handles each one. The podinfo container returns a JSON response that includes a hostname field set to the Pod name:
for i in $(seq 1 8); do
    wget -qO- http://podinfo-resilient-svc \
        | grep '"hostname"'
done
The output should show different Pod names across the requests, confirming that the Service distributes traffic across all four replicas:
"hostname": "podinfo-resilient-5b8c7d9f64-7r3qw",
"hostname": "podinfo-resilient-5b8c7d9f64-d4x9m",
"hostname": "podinfo-resilient-5b8c7d9f64-p6v2t",
"hostname": "podinfo-resilient-5b8c7d9f64-h9c3f",
"hostname": "podinfo-resilient-5b8c7d9f64-7r3qw",
"hostname": "podinfo-resilient-5b8c7d9f64-d4x9m",
"hostname": "podinfo-resilient-5b8c7d9f64-p6v2t",
"hostname": "podinfo-resilient-5b8c7d9f64-h9c3f",
Each hostname value corresponds to a different Pod, showing that the Service load-balances across all four replicas. The Service acts as a stable endpoint regardless of how many Pods are running at any given moment, which means callers never need to track individual Pod IPs.
7 Internet-facing application deployment
Design and deploy an application with its internal Service and expose it externally using the Kubernetes Gateway API with path-based routing rules.
This category includes the following learning objectives:
- Understanding of Pods.
- Understanding of Deployments.
- Understanding of ClusterIP Services.
- Understanding of the Gateway API and how a Gateway sits in front of Services.
7.1 Setup
The Gateway API requires two things to work:
- The Custom Resource Definitions (CRDs) that define the resource types.
- A Gateway controller that watches those resources and programs the actual data plane.
The tasks in this category use NGINX Gateway Fabric as the Gateway controller.
7.1.1 Install the Gateway API CRDs
The Gateway API is not bundled with Kubernetes by default, but we can reference the documentation for installation instructions.
Install the standard Gateway API CRDs:
kubectl apply -f https://github.com/kubernetes-sigs/gateway-api/releases/download/v1.2.0/standard-install.yaml
Verify that the Gateway API CRDs were created:
kubectl get crds | grep gateway.networking.k8s.io
The output should include the following core Gateway API resource types:
gatewayclasses.gateway.networking.k8s.io    2026-03-05T10:00:00Z
gateways.gateway.networking.k8s.io          2026-03-05T10:00:00Z
httproutes.gateway.networking.k8s.io        2026-03-05T10:00:00Z
7.1.2 Install NGINX Gateway Fabric
Install the NGINX Gateway Fabric CRDs:
kubectl apply -f https://raw.githubusercontent.com/nginx/nginx-gateway-fabric/v1.6.2/deploy/crds.yaml
Verify that the NGINX Gateway Fabric CRDs were created:
kubectl get crds | grep gateway.nginx.org
The output should include the following NGINX Gateway Fabric resource types:
nginxgateways.gateway.nginx.org          2026-03-05T10:00:00Z
nginxproxies.gateway.nginx.org           2026-03-05T10:00:00Z
observabilitypolicies.gateway.nginx.org  2026-03-05T10:00:00Z
Deploy NGINX Gateway Fabric:
kubectl apply -f https://raw.githubusercontent.com/nginx/nginx-gateway-fabric/v1.6.2/deploy/default/deploy.yaml
Wait for the controller to be ready:
kubectl wait --timeout=5m -n nginx-gateway \
    deployment/nginx-gateway \
    --for=condition=Available
The controller’s name may change in future releases, so if the above command fails, run the following to find the correct name:
kubectl get deployment -n nginx-gateway
Verify that the nginx GatewayClass is available:
kubectl get gatewayclass
The output should show the nginx GatewayClass in Accepted state:
NAME    CONTROLLER                                      ACCEPTED   AGE
nginx   gateway.nginx.org/nginx-gateway-controller      True       1m
7.2 Task 1: Design and deploy a public-facing application with path-based routing
Your team needs to expose two internal services to external users through a single entry point. The application consists of a main dashboard and an admin panel, each running as an independent Deployment. A Gateway sits in front of both Services and routes incoming traffic to the correct backend based on the request path: /dashboard for the main dashboard and /admin for the admin panel.
Each service must be reachable only within the cluster through a ClusterIP Service. The Gateway is the only component that accepts external traffic.
7.2.1 Architectural design
The task requires two independent applications reachable from outside the cluster through a single entry point, with path-based routing to direct traffic to the correct backend. Each application must remain internal (ClusterIP only), and only the Gateway accepts external traffic. These constraints drive four design decisions:
-
Each application runs as its own Deployment with one replica. Keeping the dashboard and the admin panel in separate Deployments means they can be scaled, updated, and rolled back independently. Each Deployment creates a ReplicaSet that manages a single Pod.
-
Each Deployment is connected with a ClusterIP Service (
dashboard-svcandadmin-svc) to provide a stable cluster-internal DNS name and load-balance traffic to the Pods. They accept requests on port80and forward them to the container port8080. Because ClusterIP has no external port, neither service is reachable from outside the cluster on its own. -
A Gateway resource (
app-gateway) is the single externally accessible component. It listens for HTTP traffic on port80and is backed by thenginxgateway. In bare-metal environments the controller exposes a NodePort Service, giving external clients a reachable port on the node IP. -
An HTTPRoute resource (
app-routes) binds to the Gateway and defines the path-based routing rules. Requests to/dashboardare forwarded todashboard-svc, and requests to/adminare forwarded toadmin-svc. A URL rewrite filter strips the path prefix before the request reaches the backend, so each application receives traffic at/regardless of the original path.
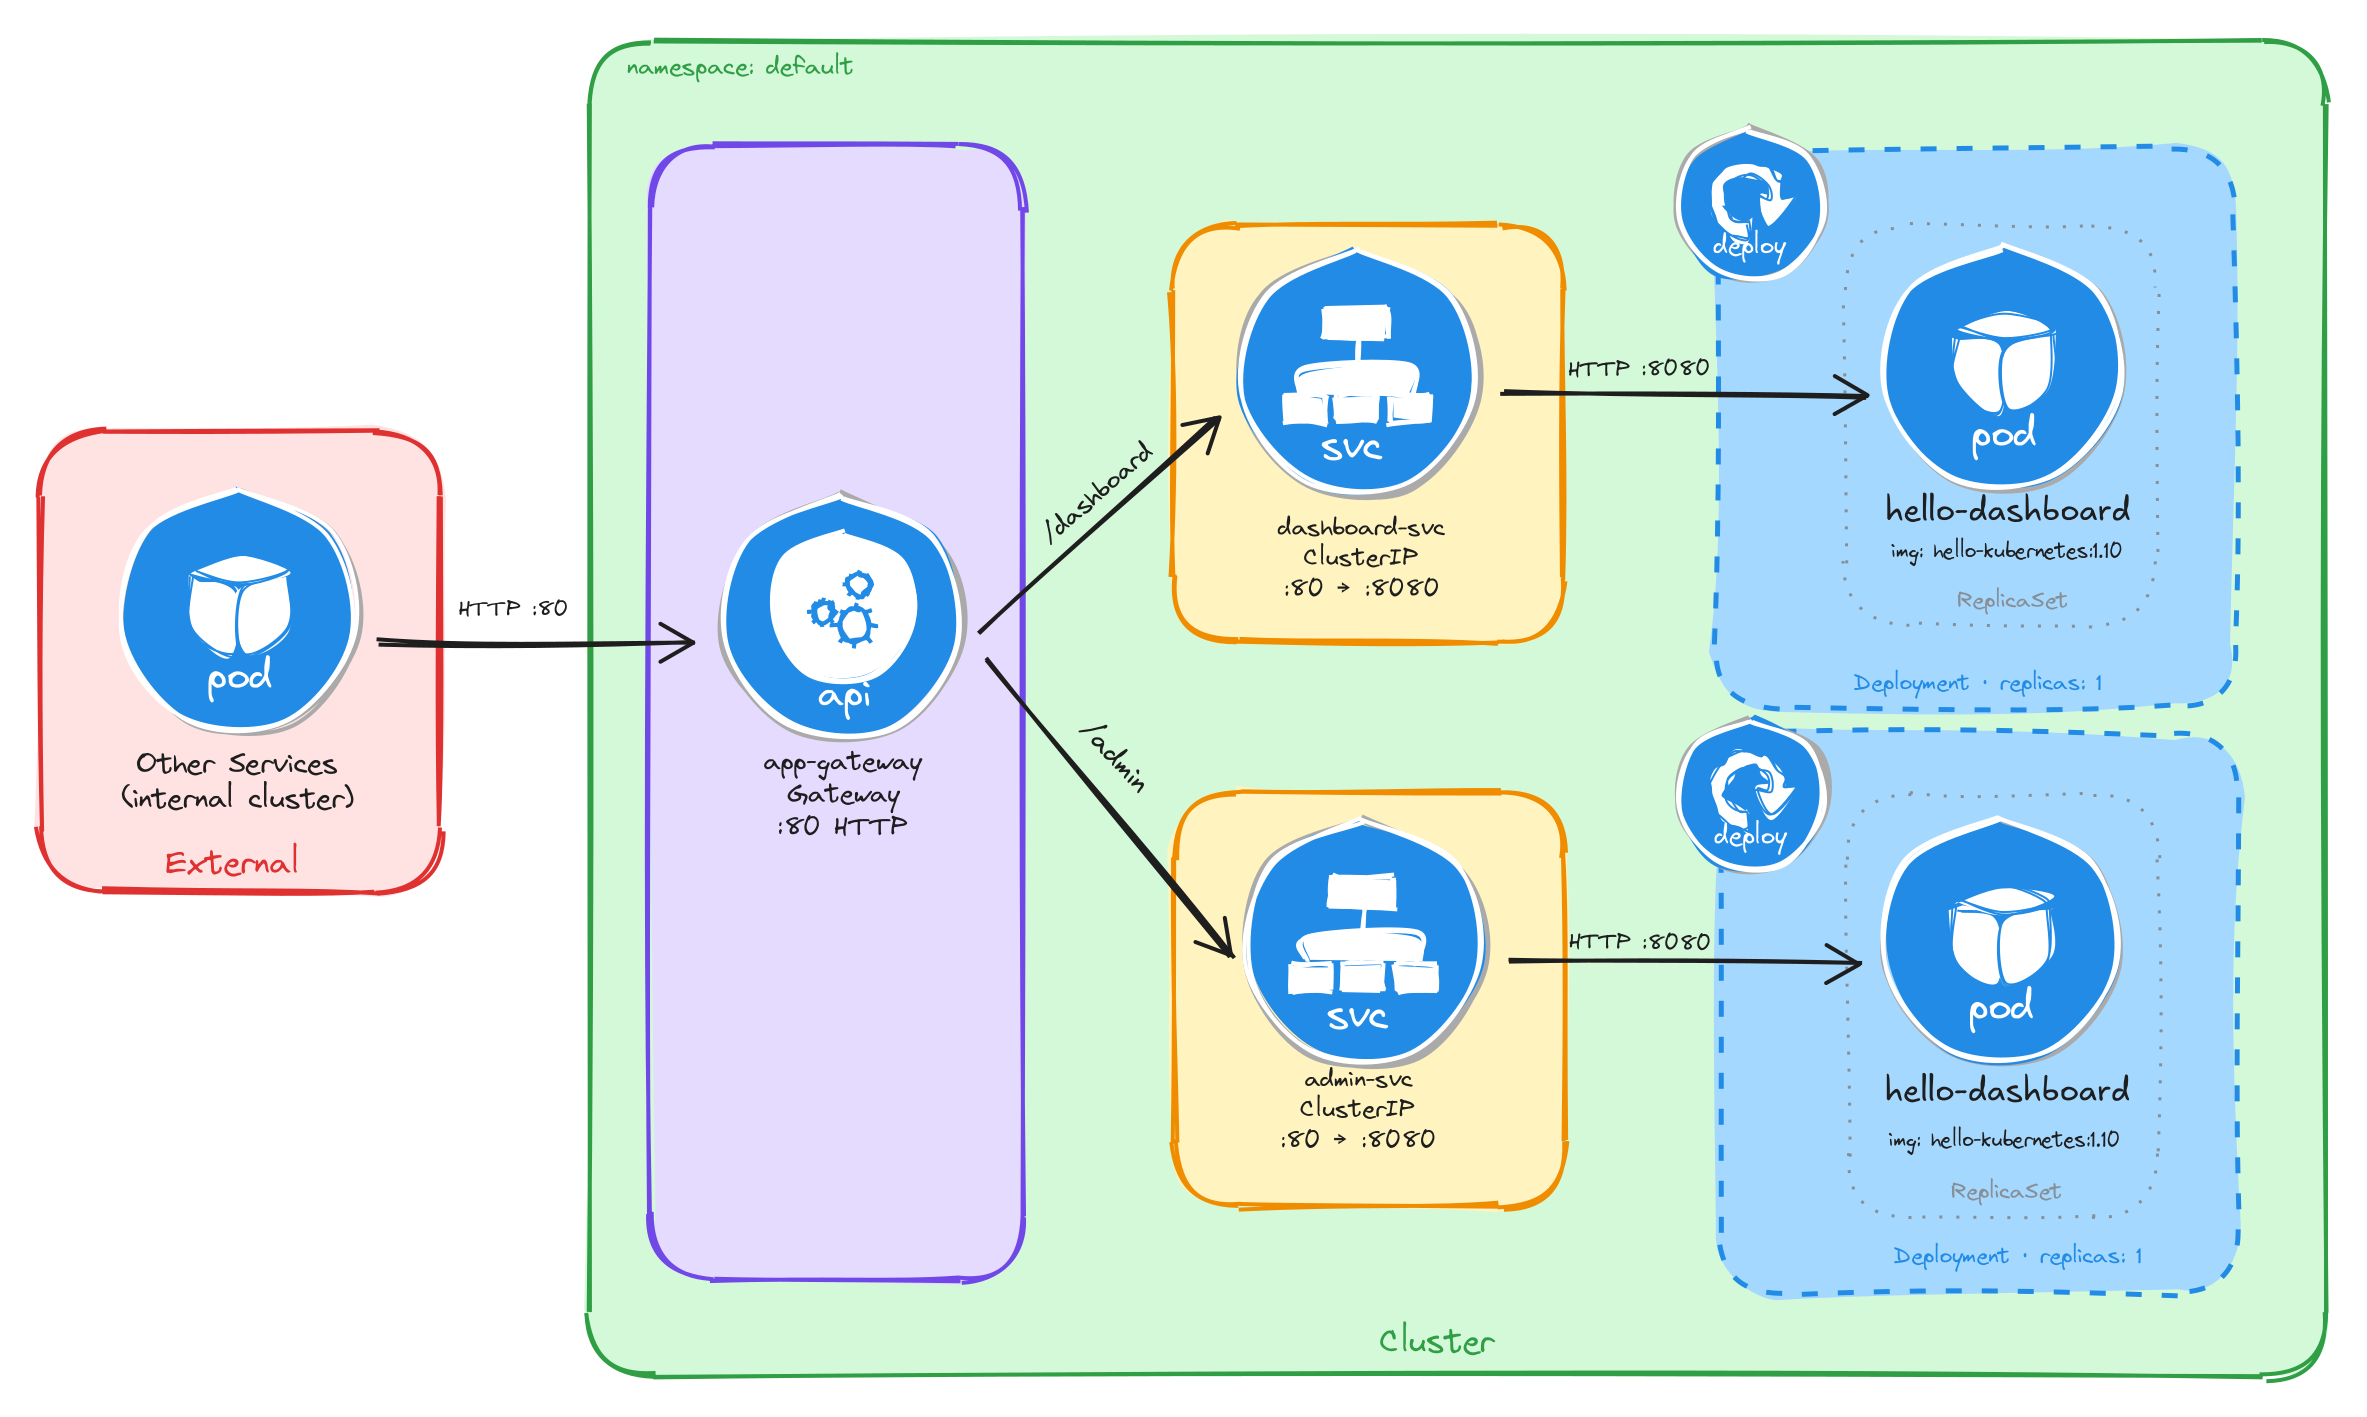
The diagram shows the resulting architecture: external clients send HTTP requests to the Gateway, which is the only component with an externally accessible port. The HTTPRoute inspects the request path and forwards traffic to the correct ClusterIP Service, which in turn reaches the Pod managed by the corresponding Deployment. The two application Services have no external route, so they are unreachable from outside the cluster without the Gateway.
7.2.2 Implementation
7.2.2.1 Deploy the applications
We start by creating the two Deployments. The MESSAGE environment variable sets a custom message in each hello-kubernetes instance, making it easy to distinguish which service is responding.
kubectl create deployment dashboard \
    --image=paulbouwer/hello-kubernetes:1.10 \
    --port=8080
kubectl set env deployment/dashboard MESSAGE="Main Dashboard"
kubectl create deployment admin \
    --image=paulbouwer/hello-kubernetes:1.10 \
    --port=8080
kubectl set env deployment/admin MESSAGE="Admin Panel"
Next, we expose each Deployment as a ClusterIP Service:
kubectl expose deployment dashboard \
    --name=dashboard-svc \
    --type=ClusterIP \
    --port=80 \
    --target-port=8080
kubectl expose deployment admin \
    --name=admin-svc \
    --type=ClusterIP \
    --port=80 \
    --target-port=8080
7.2.2.2 Create the gateway
We create a Gateway resource that listens for HTTP traffic on port 80. The gatewayClassName: nginx field references the GatewayClass provided by the installed Gateway controller:
cat <<EOF > gateway.yaml
With the following content:
apiVersion: gateway.networking.k8s.io/v1
kind: Gateway
metadata:
  name: app-gateway
spec:
  gatewayClassName: nginx
  listeners:
    - name: http
      protocol: HTTP
      port: 80
EOF
To verify the file was created correctly, run:
cat gateway.yaml
Apply the Gateway manifest:
kubectl apply -f gateway.yaml
7.2.2.3 Create the HTTP routes
We create an HTTPRoute resource that defines the path-based routing rules and binds them to the Gateway:
cat <<EOF > httproute.yaml
With the following content:
apiVersion: gateway.networking.k8s.io/v1
kind: HTTPRoute
metadata:
  name: app-routes
spec:
  parentRefs:
    - name: app-gateway
  rules:
    - matches:
        - path:
            type: PathPrefix
            value: /dashboard
      filters:
        - type: URLRewrite
          urlRewrite:
            path:
              type: ReplacePrefixMatch
              replacePrefixMatch: /
      backendRefs:
        - name: dashboard-svc
          port: 80
    - matches:
        - path:
            type: PathPrefix
            value: /admin
      filters:
        - type: URLRewrite
          urlRewrite:
            path:
              type: ReplacePrefixMatch
              replacePrefixMatch: /
      backendRefs:
        - name: admin-svc
          port: 80
EOF
A few things to note in this manifest:
- Parent reference:
parentRefsbinds this HTTPRoute to theapp-gatewayGateway, so the controller knows which Gateway should serve these routing rules. - Path-based routing: Each rule matches a path prefix and forwards traffic to the corresponding backend Service.
- URL rewrite filter: The
URLRewritefilter withReplacePrefixMatch: /strips the path prefix before forwarding the request to the backend, so the application receives requests at/regardless of the original path. For example, a request to/dashboard/homeis forwarded to the backend as/home, and a request to/dashboardis forwarded as/.
To verify the file was created correctly, run:
cat httproute.yaml
Apply the HTTPRoute manifest:
kubectl apply -f httproute.yaml
7.2.2.4 Verify resource creation
To verify that the Pods are running, execute:
kubectl get pods -l app=dashboard
kubectl get pods -l app=admin
The output for each should look similar to this:
NAME                         READY   STATUS    RESTARTS   AGE
dashboard-6bfbf8b67c-jv8tv   1/1     Running   0          1m
To verify that the Services are configured correctly, run:
kubectl get svc dashboard-svc admin-svc
The output should look similar to this:
NAME            TYPE        CLUSTER-IP     EXTERNAL-IP   PORT(S)   AGE
dashboard-svc   ClusterIP   10.96.45.12    <none>        80/TCP    1m
admin-svc       ClusterIP   10.96.78.34    <none>        80/TCP    1m
To verify that the Gateway is programmed, run:
kubectl get gateway app-gateway
The output should look similar to this:
NAME          CLASS   ADDRESS   PROGRAMMED   AGE
app-gateway   nginx             True         1m
Note: In bare-metal environments there is no cloud load balancer to assign an external IP, so the ADDRESS field will be empty. Traffic is still reachable through the node IP and the NodePort assigned to the Gateway Service.
To verify that the HTTPRoute is bound to the Gateway and accepted, run:
kubectl get httproute app-routes
The output should look similar to this:
NAME         HOSTNAMES   AGE
app-routes               1m
7.2.2.5 Test path-based routing
Store the node IP and the NodePort assigned to the Gateway Service in variables for convenience:
NODE_IP=$(kubectl get nodes \
    -o jsonpath='{.items[0].status.addresses[0].address}')
echo $NODE_IP
NODE_PORT=$(kubectl get svc -n nginx-gateway \
    -o jsonpath='{.items[0].spec.ports[0].nodePort}')
echo $NODE_PORT
Send a request to the /dashboard path:
curl -s http://$NODE_IP:$NODE_PORT/dashboard | grep -A2 'message'
The output should show the Main Dashboard message:
<div id="message">
  Main Dashboard
</div>
Send a request to the /admin path:
curl -s http://$NODE_IP:$NODE_PORT/admin | grep -A2 'message'
The output should show the Admin Panel message:
<div id="message">
  Admin Panel
</div>
This confirms that the Gateway is correctly routing requests to the appropriate backend Service based on the request path.
7.2.2.6 Verify that Services alone are not enough
ClusterIP Services are reachable within the cluster network, but they have no externally accessible port. To confirm this, compare the two Services against the Gateway Service:
kubectl get svc dashboard-svc admin-svc
kubectl get svc -n nginx-gateway
The output for the application Services will show ClusterIP type with no external IP and no NodePort:
NAME            TYPE        CLUSTER-IP     EXTERNAL-IP   PORT(S)   AGE
dashboard-svc   ClusterIP   10.96.45.12    <none>        80/TCP    5m
admin-svc       ClusterIP   10.96.78.34    <none>        80/TCP    5m
The Gateway Service, by contrast, exposes a NodePort that external clients can reach:
NAME            TYPE       CLUSTER-IP     EXTERNAL-IP   PORT(S)        AGE
nginx-gateway   NodePort   10.96.11.22    <none>        80:31234/TCP   5m
A client outside the cluster has no route to a ClusterIP address, so the application Services are unreachable from the outside regardless of whether they are running. The Gateway is the only component with an externally accessible port, and it acts as the single controlled entry point that forwards traffic to the correct internal Service based on the request path.
Note: If you are using the playground, running the command kubectl get svc -n nginx-gateway will show a LoadBalancer type with an external IP instead of NodePort, everything will still work the same.
7.2.2.7 Configure Killercoda port forwarding to access the application from the browser
If you are running this scenario in Killercoda, you can test the application from the terminal using curl as shown above, but you can also access it directly from the browser using Killercoda’s traffic forwarding feature.
Run the following command to forward the Gateway Service port to port 8080 on the node:
kubectl port-forward -n nginx-gateway svc/nginx-gateway 8080:80 --address 0.0.0.0
While the command is running, open the Killercoda traffic forwarding panel:
- Click the Traffic / Ports tab at the top of the Killercoda interface.
- Enter
8080in the port field and click Access.
A new browser tab will open pointing to the Killercoda-provided URL for port 8080. Append the path to the URL in the browser address bar to reach each service:
<killercoda-url>/dashboard— should display theMain Dashboardpage.<killercoda-url>/admin— should display theAdmin Panelpage.
To stop the port forwarding, press Ctrl+C in the terminal.
7.3 Task 2: Design and deploy a public-facing application with host-based routing
Your team needs to expose two internal microservices to external users through a single entry point. The application consists of an API service and a web frontend, each running as an independent Deployment. A Gateway sits in front of both Services and routes incoming traffic to the correct backend based on the request hostname: api.example.com for the API service and web.example.com for the web frontend.
Each service must be reachable only within the cluster through a ClusterIP Service. The Gateway is the only component that accepts external traffic.
7.3.1 Architectural design
The task requires two independent applications reachable from outside the cluster through a single entry point, with host-based routing to direct traffic to the correct backend. Each application must remain internal (ClusterIP only), and only the Gateway accepts external traffic. These constraints drive four design decisions:
-
Each application runs as its own Deployment with one replica. Keeping the API service and the web frontend in separate Deployments means they can be scaled, updated, and rolled back independently. Each Deployment creates a ReplicaSet that manages a single Pod.
-
Each Deployment is connected with a ClusterIP Service (
api-svcandweb-svc) to provide a stable cluster-internal DNS name and load-balance traffic to the Pods. They accept requests on port80and forward them to the container port8080. Because ClusterIP has no external port, neither service is reachable from outside the cluster on its own. -
A Gateway resource (
app-gateway) is the single externally accessible component. It listens for HTTP traffic on port80and is backed by thenginxgateway. In bare-metal environments the controller exposes a NodePort Service, giving external clients a reachable port on the node IP. -
Two HTTPRoute resources (
api-routeandweb-route) bind to the Gateway and define the host-based routing rules. Requests with theHostheader set toapi.example.comare forwarded toapi-svc, and requests with theHostheader set toweb.example.comare forwarded toweb-svc. Each HTTPRoute matches on a specific hostname instead of a path prefix, so the Gateway inspects theHostheader to decide which backend receives the request.

The diagram shows the resulting architecture: external clients send HTTP requests to the Gateway, which is the only component with an externally accessible port. The HTTPRoute resources inspect the request hostname and forward traffic to the correct ClusterIP Service, which in turn reaches the Pod managed by the corresponding Deployment. The two application Services have no external route, so they are unreachable from outside the cluster without the Gateway.
7.3.2 Implementation
7.3.2.1 Deploy the applications
We start by creating the two Deployments. The MESSAGE environment variable sets a custom message in each hello-kubernetes instance, making it easy to distinguish which service is responding.
kubectl create deployment api \
    --image=paulbouwer/hello-kubernetes:1.10 \
    --port=8080
kubectl set env deployment/api MESSAGE="API Service"
kubectl create deployment web \
    --image=paulbouwer/hello-kubernetes:1.10 \
    --port=8080
kubectl set env deployment/web MESSAGE="Web Frontend"
Next, we expose each Deployment as a ClusterIP Service:
kubectl expose deployment api \
    --name=api-svc \
    --type=ClusterIP \
    --port=80 \
    --target-port=8080
kubectl expose deployment web \
    --name=web-svc \
    --type=ClusterIP \
    --port=80 \
    --target-port=8080
7.3.2.2 Create the gateway
We create a Gateway resource that listens for HTTP traffic on port 80. The gatewayClassName: nginx field references the GatewayClass provided by the installed Gateway controller:
cat <<EOF > gateway.yaml
With the following content:
apiVersion: gateway.networking.k8s.io/v1
kind: Gateway
metadata:
  name: app-gateway
spec:
  gatewayClassName: nginx
  listeners:
    - name: http
      protocol: HTTP
      port: 80
EOF
To verify the file was created correctly, run:
cat gateway.yaml
Apply the Gateway manifest:
kubectl apply -f gateway.yaml
7.3.2.3 Create the HTTP routes
Unlike Task 1, where a single HTTPRoute with multiple path-based rules directed traffic to different backends, this task uses two separate HTTPRoute resources, each matching on a specific hostname. This approach maps naturally to host-based routing: each hostname corresponds to an independent application, so keeping the routes separate makes ownership and lifecycle management clearer.
We create the first HTTPRoute for the API service, matching requests with the Host header set to api.example.com:
cat <<EOF > api-route.yaml
With the following content:
apiVersion: gateway.networking.k8s.io/v1
kind: HTTPRoute
metadata:
  name: api-route
spec:
  parentRefs:
    - name: app-gateway
  hostnames:
    - api.example.com
  rules:
    - backendRefs:
        - name: api-svc
          port: 80
EOF
We create the second HTTPRoute for the web frontend, matching requests with the Host header set to web.example.com:
cat <<EOF > web-route.yaml
With the following content:
apiVersion: gateway.networking.k8s.io/v1
kind: HTTPRoute
metadata:
  name: web-route
spec:
  parentRefs:
    - name: app-gateway
  hostnames:
    - web.example.com
  rules:
    - backendRefs:
        - name: web-svc
          port: 80
EOF
A few things to note in these manifests:
- Parent reference:
parentRefsbinds each HTTPRoute to theapp-gatewayGateway, so the controller knows which Gateway should serve these routing rules. - Host-based routing: Each HTTPRoute matches on a specific hostname using the
hostnamesfield. The Gateway inspects theHostheader of incoming requests and forwards traffic to the HTTPRoute whose hostname matches. - No URL rewrite needed: Unlike path-based routing, host-based routing does not alter the request path, so the backend receives the request exactly as the client sent it. No
URLRewritefilter is required.
To verify the files were created correctly, run:
cat api-route.yaml
cat web-route.yaml
Apply both HTTPRoute manifests:
kubectl apply -f api-route.yaml
kubectl apply -f web-route.yaml
7.3.2.4 Verify resource creation
To verify that the Pods are running, execute:
kubectl get pods -l app=api
kubectl get pods -l app=web
The output for each should look similar to this:
NAME                   READY   STATUS    RESTARTS   AGE
api-7c4f8b6d9e-m3k2p   1/1     Running   0          1m
To verify that the Services are configured correctly, run:
kubectl get svc api-svc web-svc
The output should look similar to this:
NAME      TYPE        CLUSTER-IP     EXTERNAL-IP   PORT(S)   AGE
api-svc   ClusterIP   10.96.52.18    <none>        80/TCP    1m
web-svc   ClusterIP   10.96.89.41    <none>        80/TCP    1m
To verify that the Gateway is programmed, run:
kubectl get gateway app-gateway
The output should look similar to this:
NAME          CLASS   ADDRESS   PROGRAMMED   AGE
app-gateway   nginx             True         1m
Note: In bare-metal environments there is no cloud load balancer to assign an external IP, so the ADDRESS field will be empty. Traffic is still reachable through the node IP and the NodePort assigned to the Gateway Service.
To verify that both HTTPRoutes are bound to the Gateway and accepted, run:
kubectl get httproute api-route web-route
The output should look similar to this:
NAME        HOSTNAMES              AGE
api-route   ["api.example.com"]    1m
web-route   ["web.example.com"]    1m
7.3.2.5 Test host-based routing
Store the node IP and the NodePort assigned to the Gateway Service in variables for convenience:
NODE_IP=$(kubectl get nodes \
    -o jsonpath='{.items[0].status.addresses[0].address}')
echo $NODE_IP
NODE_PORT=$(kubectl get svc -n nginx-gateway \
    -o jsonpath='{.items[0].spec.ports[0].nodePort}')
echo $NODE_PORT
Send a request with the Host header set to api.example.com:
curl -s -H "Host: api.example.com" \
    http://$NODE_IP:$NODE_PORT/ | grep -A2 'message'
The output should show the API Service message:
<div id="message">
  API Service
</div>
Send a request with the Host header set to web.example.com:
curl -s -H "Host: web.example.com" \
    http://$NODE_IP:$NODE_PORT/ | grep -A2 'message'
The output should show the Web Frontend message:
<div id="message">
  Web Frontend
</div>
This confirms that the Gateway is correctly routing requests to the appropriate backend Service based on the request hostname.
7.3.2.6 Verify that Services alone are not enough
ClusterIP Services are reachable within the cluster network, but they have no externally accessible port. To confirm this, compare the two Services against the Gateway Service:
kubectl get svc api-svc web-svc
kubectl get svc -n nginx-gateway
The output for the application Services will show ClusterIP type with no external IP and no NodePort:
NAME      TYPE        CLUSTER-IP     EXTERNAL-IP   PORT(S)   AGE
api-svc   ClusterIP   10.96.52.18    <none>        80/TCP    5m
web-svc   ClusterIP   10.96.89.41    <none>        80/TCP    5m
The Gateway Service, by contrast, exposes a NodePort that external clients can reach:
NAME            TYPE       CLUSTER-IP     EXTERNAL-IP   PORT(S)        AGE
nginx-gateway   NodePort   10.96.11.22    <none>        80:31234/TCP   5m
A client outside the cluster has no route to a ClusterIP address, so the application Services are unreachable from the outside regardless of whether they are running. The Gateway is the only component with an externally accessible port, and it acts as the single controlled entry point that forwards traffic to the correct internal Service based on the request hostname.
Note: If you are using the playground, running the command kubectl get svc -n nginx-gateway will show a LoadBalancer type with an external IP instead of NodePort, everything will still work the same.
7.3.2.7 Configure Killercoda port forwarding to access the application from the browser
If you are running this scenario in Killercoda, you can test the application from the terminal using curl as shown above. However, accessing host-based routing from the browser requires the browser to send the correct Host header, which only happens when the hostname resolves to the Gateway’s address.
Run the following command to forward the Gateway Service port to port 8080 on the node:
kubectl port-forward -n nginx-gateway svc/nginx-gateway 8080:80 --address 0.0.0.0
While the command is running, you can test from another terminal using curl with the Host header pointing to localhost:
curl -s -H "Host: api.example.com" http://localhost:8080/ | grep -A2 'message'
curl -s -H "Host: web.example.com" http://localhost:8080/ | grep -A2 'message'
Note: Unlike path-based routing, host-based routing cannot be tested directly from the browser using the Killercoda-provided URL, because the browser sends the Killercoda hostname in the Host header, not api.example.com or web.example.com. To test from a browser, you would need to add entries to your local /etc/hosts file mapping both hostnames to the node IP, which is not possible in the Killercoda environment. The curl commands above are the recommended way to verify host-based routing in this setup.
To stop the port forwarding, press Ctrl+C in the terminal.